
Browsing Category
Uncategorized
616 posts
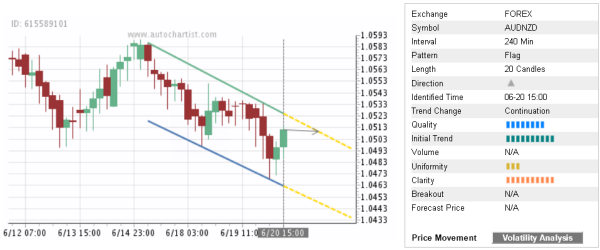
Trade of the Day: AUD/NZD
By: Dima Chernovolov AUD/NZD continues to rise inside the 4-hour Down Channel chart pattern which was earlier identified by Autochartist. Autochartist rates the quality of this Down Channel at the 8-bar level – which is the result of the sharp Initial Trend (10 bars), higher Uniformity (3 bars) and substantial Clarity (9 bars). AUD/NZD is…
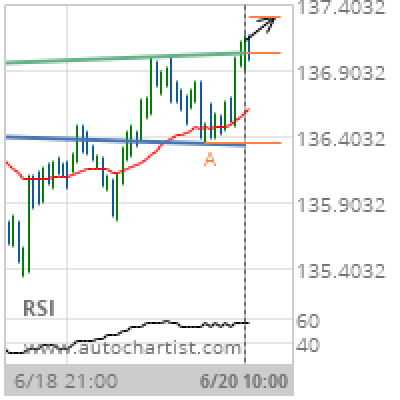
GBP/JPY Target Level: 137.3049
Inverse Head and Shoulders has broken through the resistance line at 20-Jun-2019 10:00 UTC. Possible bullish price movement forecast for the next day towards 137.3049. Supported by Upward sloping Moving Average Chart 1 hourPattern Inverse Head and ShouldersLength 84 CandlesIdentified 20-Jun-2019 10:00 UTC
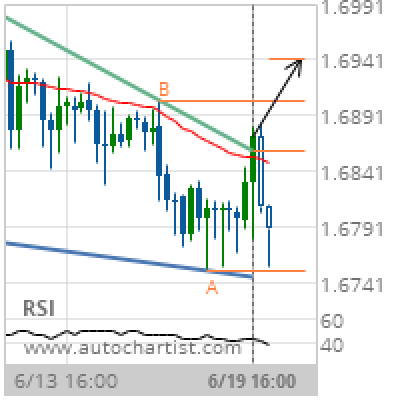
GBP/CAD Target Level: 1.6942
Falling Wedge has broken through the resistance line at 19-Jun-2019 16:00 UTC. Possible bullish price movement forecast for the next 3 days towards 1.6942. Supported by RSI below 40 Chart 4 hourPattern Falling WedgeLength 56 CandlesIdentified 19-Jun-2019 16:00 UTC
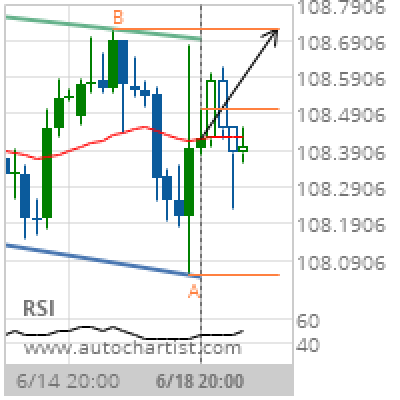
USD/JPY Target Level: 108.7230
Channel Down identified at 18-Jun-2019 20:00 UTC. This pattern is still in the process of forming. Possible bullish price movement towards the resistance 108.7230 within the next day. Supported by Upward sloping Moving Average Chart 4 hourPattern Channel DownLength 32 CandlesIdentified 18-Jun-2019 20:00 UTC
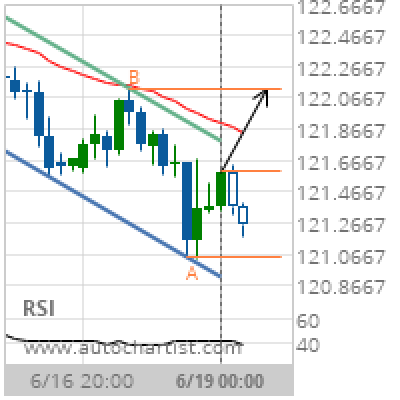
EUR/JPY Target Level: 122.1260
Channel Down identified at 19-Jun-2019 00:00 UTC. This pattern is still in the process of forming. Possible bullish price movement towards the resistance 122.1260 within the next day. Supported by RSI below 40 Chart 4 hourPattern Channel DownLength 33 CandlesIdentified 19-Jun-2019 00:00 UTC
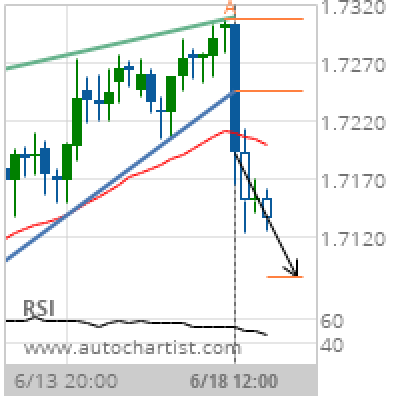
EUR/NZD Target Level: 1.7086
Rising Wedge has broken through the support line at 18-Jun-2019 12:00 UTC. Possible bearish price movement forecast for the next 2 days towards 1.7086. Supported by Downward sloping Moving Average Chart 4 hourPattern Rising WedgeLength 39 CandlesIdentified 18-Jun-2019 12:00 UTC
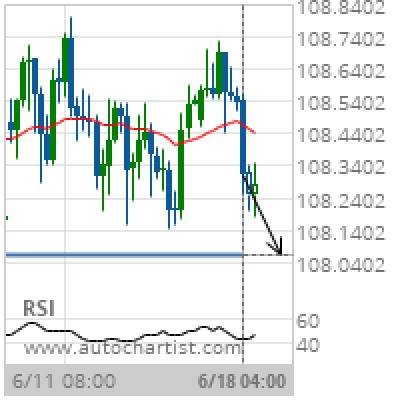
USD/JPY Target Level: 108.0630
Approaching Support level of 108.0630 identified at 18-Jun-2019 04:00 UTC Supported by Downward sloping Moving Average Chart 4 hourPattern SupportLength 68 CandlesIdentified 18-Jun-2019 04:00 UTC
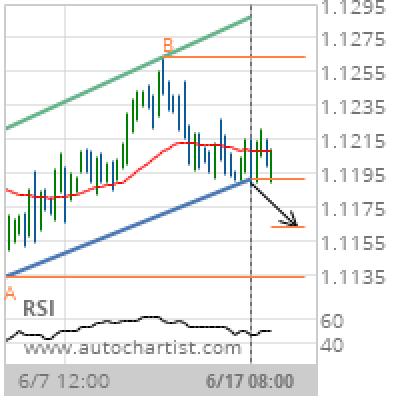
EUR/CHF Target Level: 1.1164
Channel Up has broken through the support line at 17-Jun-2019 08:00 UTC. Possible bearish price movement forecast for the next 3 days towards 1.1164. Supported by Downward sloping Moving Average Chart 4 hourPattern Channel UpLength 62 CandlesIdentified 17-Jun-2019 08:00 UTC
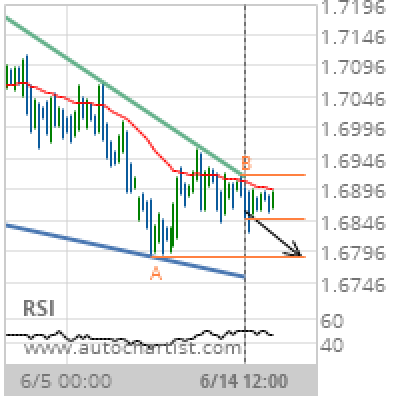
GBP/CAD Target Level: 1.6788
Falling Wedge identified at 14-Jun-2019 12:00 UTC. This pattern is still in the process of forming. Possible bearish price movement towards the support 1.6788 within the next 3 days. Supported by Downward sloping Moving Average Chart 4 hourPattern Falling WedgeLength 104 CandlesIdentified 14-Jun-2019 12:00 UTC
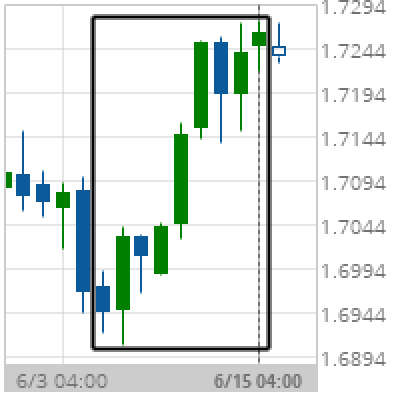
Big Movement EUR/NZD
EUR/NZD experienced a 1.7% bullish movement in the last 10 days. Chart DailyPattern Big MovementLength 9 CandlesIdentified 15-Jun-2019 04:00 UTC