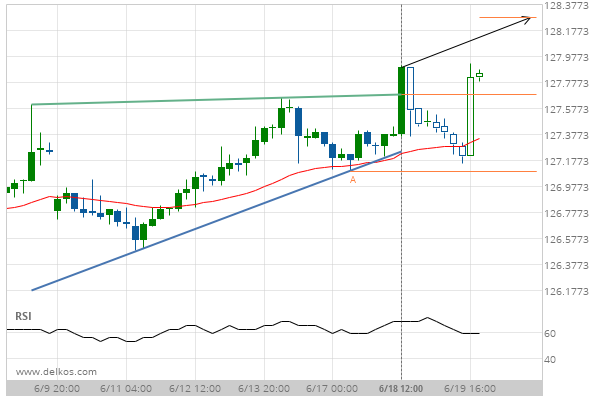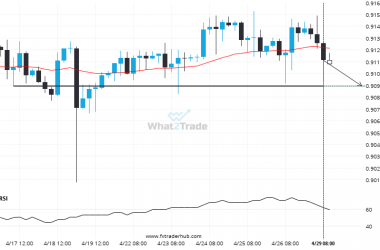
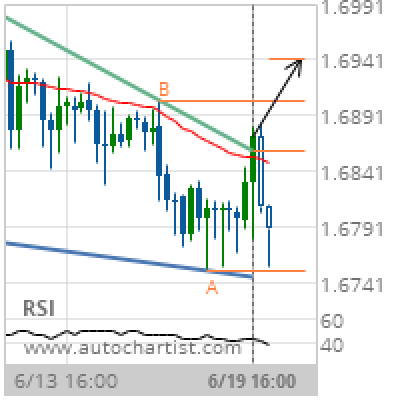

Falling Wedge has broken through the resistance line at 19-Jun-2019 16:00 UTC. Possible bullish price movement forecast for the next 3 days towards 1.6942. Supported by RSI below 40
Chart 4 hour
Pattern Falling Wedge
Length 56 Candles
Identified 19-Jun-2019 16:00 UTC