

Browsing Category
Uncategorized
616 posts
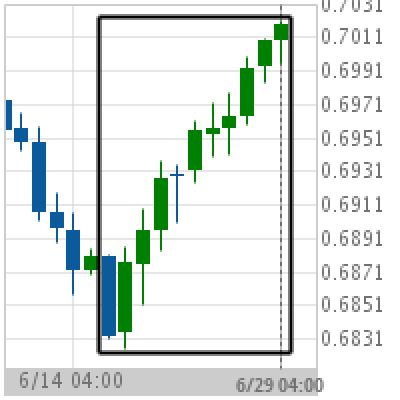
Big Movement AUD/USD
AUD/USD experienced a 2% bullish movement in the last 12 days. Chart DailyPattern Big MovementLength 11 CandlesIdentified 29-Jun-2019 04:00 UTC
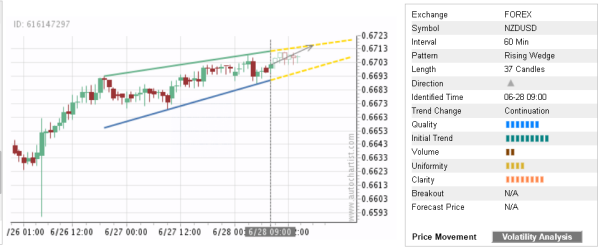
Trade of the Day: NZD/USD
By: Dima Chernovolov NZD/USD continues to rise inside the hourly Rising Wedge chart pattern which was earlier identified by Autochartist. Autochartist rates the quality of this Rising Wedge at the 7-bar level – which is the result of the strong Initial Trend (9 bars), below-average Uniformity (4 bars) and higher Clarity (8 bars). NZD/USD is…
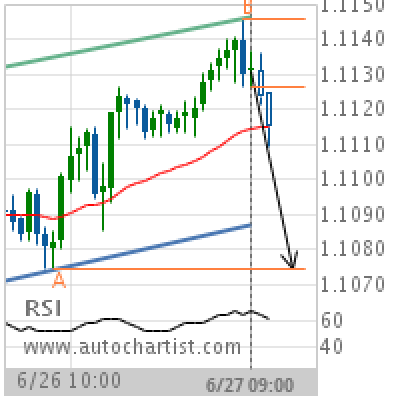
EUR/CHF Target Level: 1.1074
Channel Up identified at 27-Jun-2019 09:00 UTC. This pattern is still in the process of forming. Possible bearish price movement towards the support 1.1074 within the next 15 hours. Supported by RSI above 60 Chart 1 hourPattern Channel UpLength 52 CandlesIdentified 27-Jun-2019 09:00 UTC
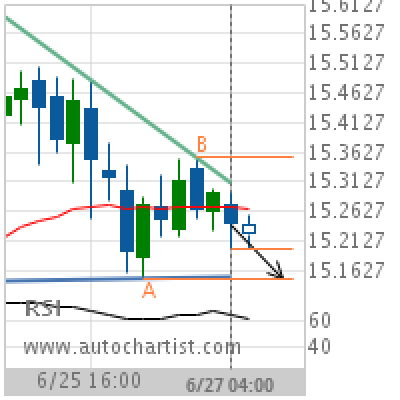
XAG/USD Target Level: 15.1500
Descending Triangle identified at 27-Jun-2019 04:00 UTC. This pattern is still in the process of forming. Possible bearish price movement towards the support 15.1500 within the next day. Supported by RSI above 60 Chart 4 hourPattern Descending TriangleLength 23 CandlesIdentified 27-Jun-2019 04:00 UTC
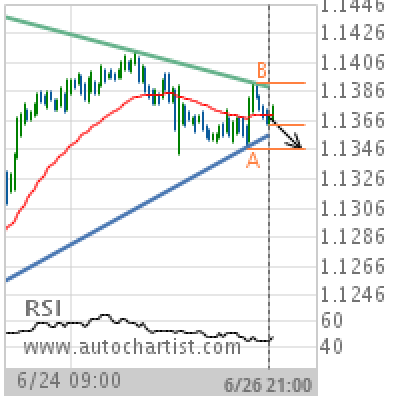
EUR/USD Target Level: 1.1347
Triangle identified at 26-Jun-2019 21:00 UTC. This pattern is still in the process of forming. Possible bearish price movement towards the support 1.1347 within the next 2 days. Supported by Downward sloping Moving Average Chart 1 hourPattern TriangleLength 133 CandlesIdentified 26-Jun-2019 21:00 UTC
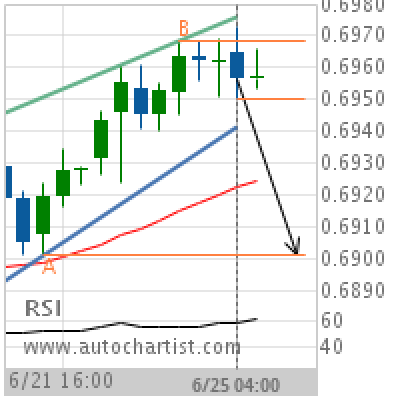
AUD/USD Target Level: 0.6901
Pennant identified at 25-Jun-2019 04:00 UTC. This pattern is still in the process of forming. Possible bearish price movement towards the support 0.6901 within the next 22 hours. Supported by RSI above 60 Chart 4 hourPattern PennantLength 21 CandlesIdentified 25-Jun-2019 04:00 UTC
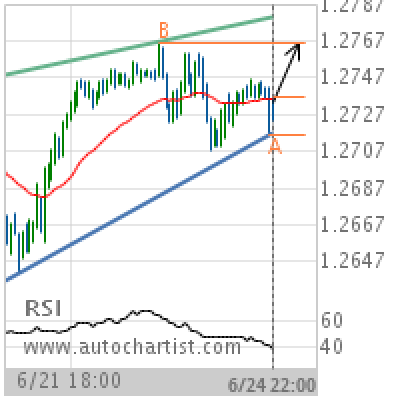
GBP/USD Target Level: 1.2766
Rising Wedge identified at 24-Jun-2019 22:00 UTC. This pattern is still in the process of forming. Possible bullish price movement towards the resistance 1.2766 within the next 21 hours. Supported by RSI below 40 Chart 30 MinutesPattern Rising WedgeLength 124 CandlesIdentified 24-Jun-2019 22:00 UTC
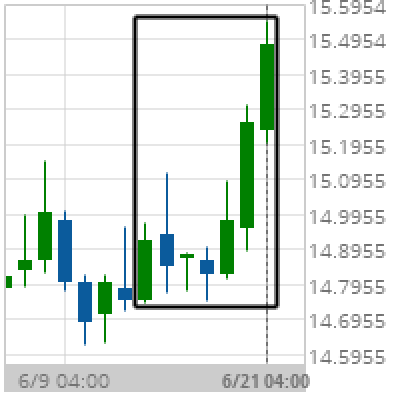
Big Movement XAG/USD
XAG/USD experienced a 4.97% bullish movement in the last 8 days. Chart DailyPattern Big MovementLength 7 CandlesIdentified 21-Jun-2019 04:00 UTC
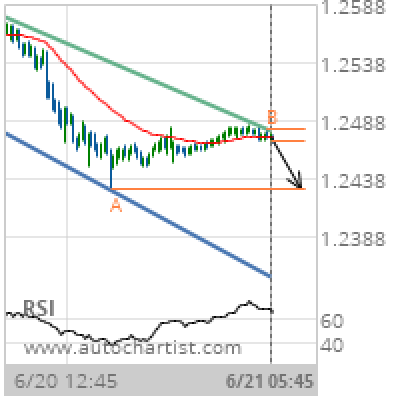
GBP/CHF Target Level: 1.2429
Channel Down identified at 21-Jun-2019 05:45 UTC. This pattern is still in the process of forming. Possible bearish price movement towards the support 1.2429 within the next 12 hours. Supported by RSI above 60 Chart 15 MinutesPattern Channel DownLength 149 CandlesIdentified 21-Jun-2019 05:45 UTC
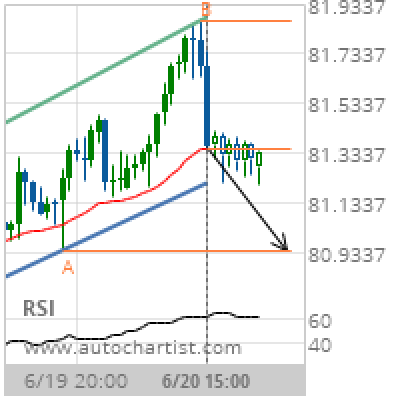
CAD/JPY Target Level: 80.9420
Channel Up identified at 20-Jun-2019 15:00 UTC. This pattern is still in the process of forming. Possible bearish price movement towards the support 80.9420 within the next 9 hours. Supported by RSI above 60 Chart 1 hourPattern Channel UpLength 49 CandlesIdentified 20-Jun-2019 15:00 UTC