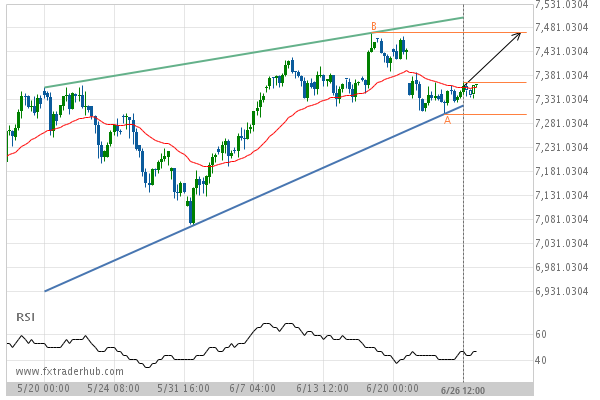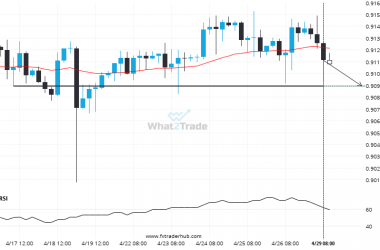
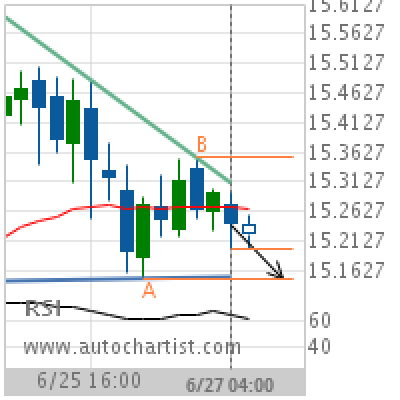

Descending Triangle identified at 27-Jun-2019 04:00 UTC. This pattern is still in the process of forming. Possible bearish price movement towards the support 15.1500 within the next day. Supported by RSI above 60
Chart 4 hour
Pattern Descending Triangle
Length 23 Candles
Identified 27-Jun-2019 04:00 UTC