
Browsing Category
Uncategorized
616 posts
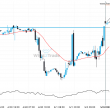
NZD/JPY Target Level: 72.3300
Triangle identified at 20-Dec-2019 08:45 UTC. This pattern is still in the process of forming. Possible bullish price movement towards the resistance 72.3300 within the next 14 hours. Supported by RSI below 40 Chart 15 MinutesPattern TriangleLength 190 CandlesIdentified 20-Dec-2019 08:45 UTC
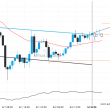
EUR/NZD Target Level: 1.6990
Channel Down identified at 19-Dec-2019 13:00 UTC. This pattern is still in the process of forming. Possible bullish price movement towards the resistance 1.6990 within the next 2 days. Supported by RSI below 40 Chart 4 hourPattern Channel DownLength 39 CandlesIdentified 19-Dec-2019 13:00 UTC
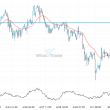
XAG/USD Target Level: 16.8300
Approaching Support level of 16.8300 identified at 19-Dec-2019 09:00 UTC Supported by RSI above 60 Chart 1 hourPattern SupportLength 289 CandlesIdentified 19-Dec-2019 09:00 UTC
GBP/CAD Target Level: 1.7274
Falling Wedge identified at 18-Dec-2019 20:30 UTC. This pattern is still in the process of forming. Possible bullish price movement towards the resistance 1.7274 within the next 11 hours. Supported by RSI below 40 Chart 30 MinutesPattern Falling WedgeLength 77 CandlesIdentified 18-Dec-2019 20:30 UTC
USD/CHF Target Level: 0.9793
Falling Wedge identified at 18-Dec-2019 11:00 UTC. This pattern is still in the process of forming. Possible bearish price movement towards the support 0.9793 within the next day. Supported by Downward sloping Moving Average Chart 1 hourPattern Falling WedgeLength 84 CandlesIdentified 18-Dec-2019 11:00 UTC
NZD/JPY Target Level: 71.7290
Falling Wedge identified at 18-Dec-2019 05:15 UTC. This pattern is still in the process of forming. Possible bearish price movement towards the support 71.7290 within the next 21 hours. Supported by RSI above 60 Chart 15 MinutesPattern Falling WedgeLength 258 CandlesIdentified 18-Dec-2019 05:15 UTC
GBP/USD Target Level: 1.3422
Channel Down identified at 17-Dec-2019 21:30 UTC. This pattern is still in the process of forming. Possible bullish price movement towards the resistance 1.3422 within the next 22 hours. Supported by RSI below 40 Chart 30 MinutesPattern Channel DownLength 134 CandlesIdentified 17-Dec-2019 21:30 UTC
EUR/USD Target Level: 1.1199
Channel Up identified at 17-Dec-2019 11:00 UTC. This pattern is still in the process of forming. Possible bullish price movement towards the resistance 1.1199 within the next 3 days. Supported by Upward sloping Moving Average Chart 1 hourPattern Channel UpLength 211 CandlesIdentified 17-Dec-2019 11:00 UTC
XAU/USD Target Level: 1462.5000
Triangle identified at 17-Dec-2019 01:00 UTC. This pattern is still in the process of forming. Possible bearish price movement towards the support 1462.5000 within the next 2 days. Supported by RSI above 60 Chart 4 hourPattern TriangleLength 44 CandlesIdentified 17-Dec-2019 01:00 UTC
CAD/JPY Target Level: 82.6900
Rising Wedge identified at 16-Dec-2019 20:00 UTC. This pattern is still in the process of forming. Possible bearish price movement towards the support 82.6900 within the next 12 hours. Supported by RSI above 60 Chart 1 hourPattern Rising WedgeLength 45 CandlesIdentified 16-Dec-2019 20:00 UTC