
Day: October 25, 2019
18 posts
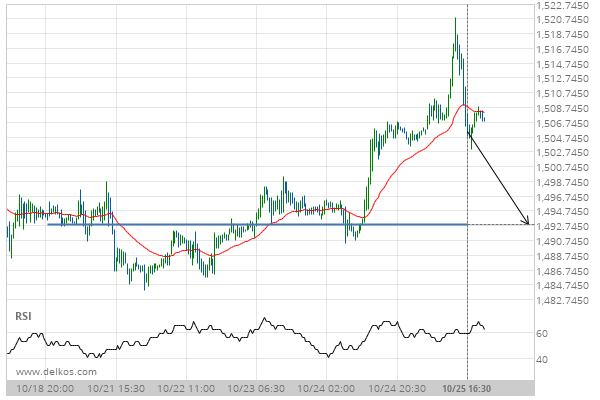
A final push expected on Gold DECEMBER 2019 as it starts approaching a price line of 1492.9000.
Gold DECEMBER 2019 is heading towards a price line of 1492.9000 and could reach this point within the…
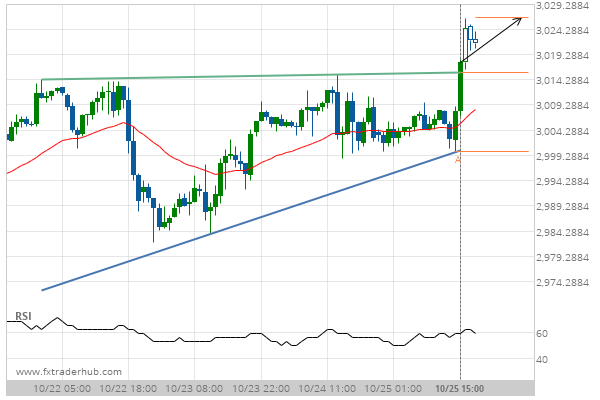
Breach of resistance could mean a start of a bullish trend on SPX500
SPX500 has broken through a resistance line of a Ascending Triangle chart pattern. If this breakout holds true,…
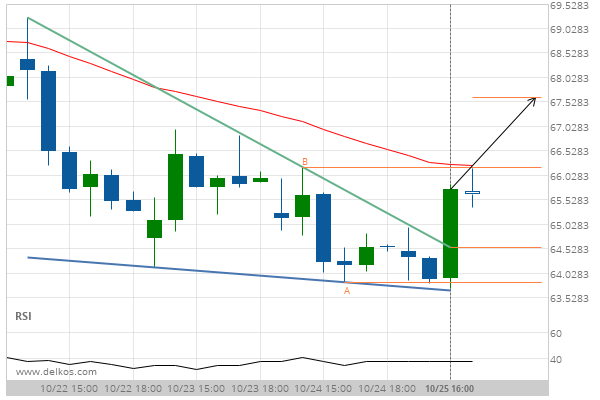
After testing resistance twice in the past, Lean Hogs DECEMBER 2019 has finally broken through. Can we expect a bullish trend to follow?
The breakout of Lean Hogs DECEMBER 2019 through the resistance line of a Falling Wedge could be a…
Breach of resistance could mean a start of a bullish trend on DASHGBP
DASHGBP has broken through a resistance line of a Channel Down chart pattern. If this breakout holds true,…
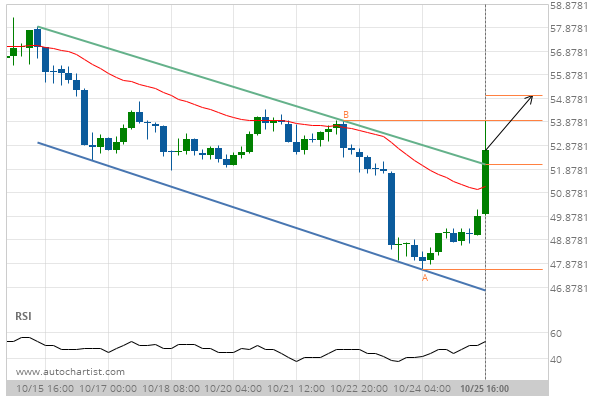
Big movement expected on US Treasury Bond DECEMBER 2019 after a breach of the resistance
US Treasury Bond DECEMBER 2019 has broken through a resistance line of a Falling Wedge and suggests a…
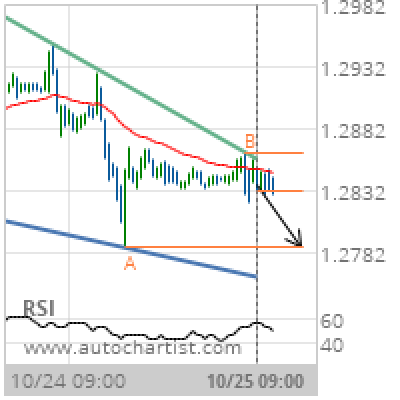
GBP/USD Target Level: 1.2786
Falling Wedge identified at 25-Oct-2019 09:00 UTC. This pattern is still in the process of forming. Possible bearish price movement towards the support 1.2786 within the next 16 hours. Supported by Downward sloping Moving Average Chart 30 MinutesPattern Falling WedgeLength 107 CandlesIdentified 25-Oct-2019 09:00 UTC
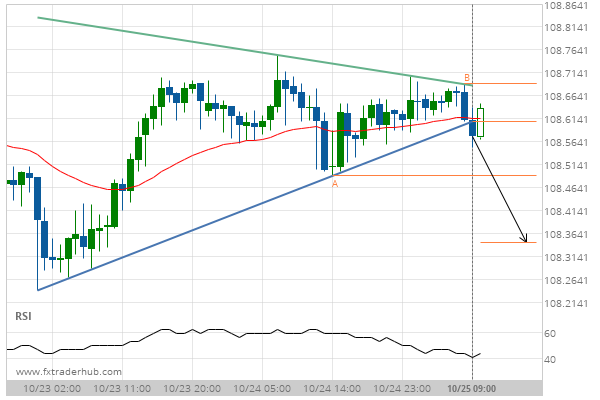
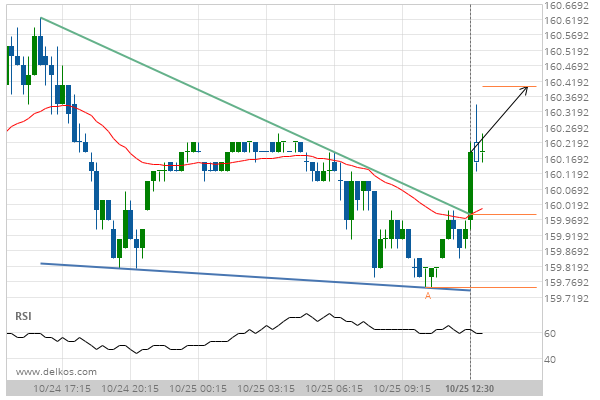
After testing support twice in the past, USD/JPY has finally broken through. Can we expect a bearish trend to follow?
The breakout of USD/JPY through the support line of a Triangle could be a sign of the road…
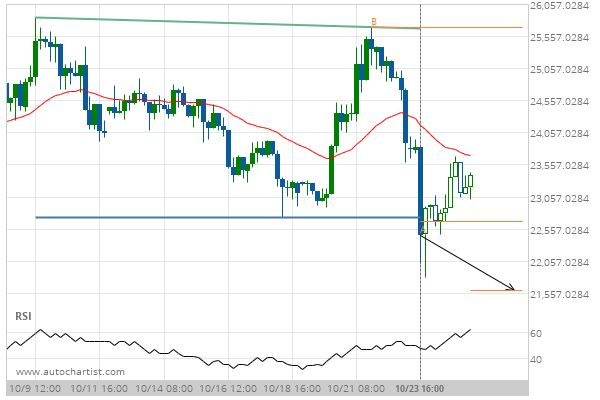
Breach of support could mean a start of a bearish trend on BCHJPY
BCHJPY has broken through a support line of a Double Top chart pattern. If this breakout holds true,…
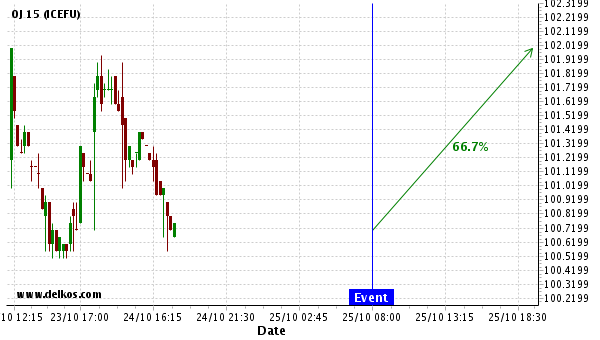
We expect OJ to trend upwards right now.
Historical events that allowed us to draw this conclusion 24 Sep 08:00 24 Jun 08:00 25 Mar 09:00…
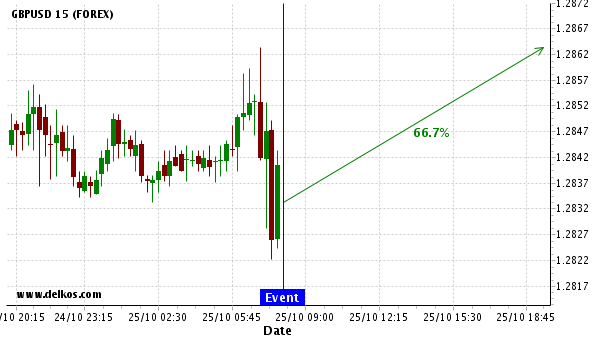
We expect GBPUSD to trend upwards for the next 12 hours.
Historical events that allowed us to draw this conclusion 24 Sep 08:00 24 Jun 08:00 All references to…