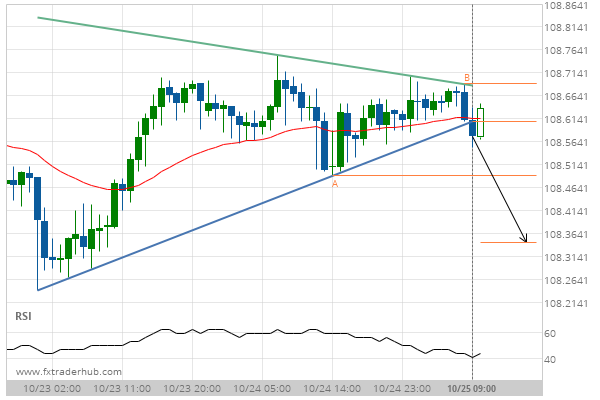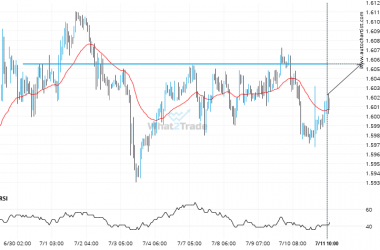
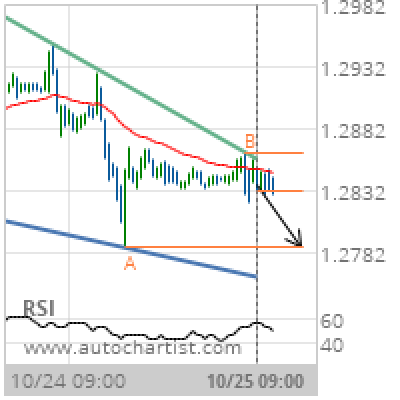

Falling Wedge identified at 25-Oct-2019 09:00 UTC. This pattern is still in the process of forming. Possible bearish price movement towards the support 1.2786 within the next 16 hours. Supported by Downward sloping Moving Average
Chart 30 Minutes
Pattern Falling Wedge
Length 107 Candles
Identified 25-Oct-2019 09:00 UTC