
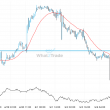

XRPUSD has broken through the resistance line of a Ascending Triangle technical chart pattern. Because we have seen it retrace from this line in the past, one should wait for confirmation of the breakout before taking any action. It has touched this line twice in the last 22 hours and suggests a possible target level to be around 0.8073 within the next 7 hours.
Related Posts

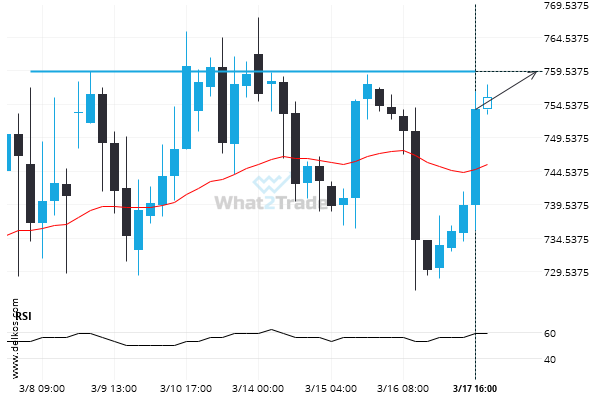
Important price line being approached by ADAUSD. This price has been tested numerous times before.
ADAUSD is moving towards a key resistance level at 0.4788. ADAUSD has previously tested this level 5 times…

Extreme movement experienced on BTCEUR. Check this chart to see what to do next
BTCEUR has experienced an exceptionally large movement lower by 12.19% from 62752.58 to 55105.34 in the last 12…

BTCAUD moves lower to 90246.31 in the last 12 days.
BTCAUD has moved lower by 12.77% from 103463.69 to 90246.31 in the last 12 days.