
Candlestick charts can provide an abundance of information to the trader. However, an oftentimes overlooked aspect of these charts is the trading information provided by longer wicked candles – especially when it comes to stop placement.
This is an opportunity particularly overlooked by newer traders who tend to decide where to place their stop based on some random number. That number may be derived from how many pips they are comfortable losing or simply some nice round number like 10 or 50.
Unfortunately, the downfall of choosing an arbitrary number often means stop placement usually bears no relationship to the chart’s price action.
When placing your stops, a more effective method is to look for levels of support in a buy or levels of resistance in a sell.
Essentially, when buying, the stop would go below a level of support, and when selling, the stop would go above the level of resistance. This ensures your stop levels are in line with the 5% rule of Money Management, which is critical to any method.
To get the best out of this approach, you can use long wicks in the analysis to guide your placement.
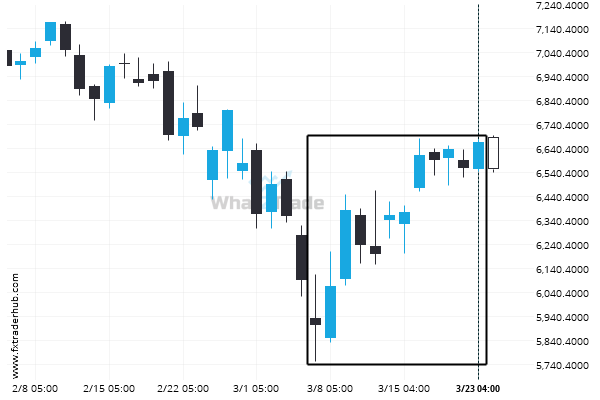
The historical 1-hour chart of the GBPJPY below provides an excellent example of long wicks…
The black rectangles on the chart show where longer wicks are making an appearance. You can see that the wicks are extended relative to the length of the other wicks around them on the chart.
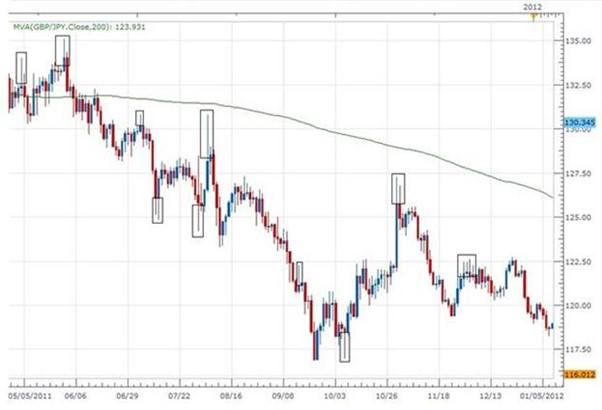
Notice that after a long wick makes an appearance, oftentimes price will move in the opposite direction of the long wick for a period of time.
In other words, if the longer wick is below the body of the candle, price has a tendency to move up. Conversely, if the longer wick is above the body of the candle, price has a tendency to move down.
So why is that you may ask.
An extended wick at the bottom of a candle shows that sellers were able to push the price down significantly. That is one aspect of what has created the long wick.
However, the selling volume was not great enough to keep the price at that low level. The buyers were able to push price back up from the low – the bottom of the wick – thereby showing strength. That is the second aspect contributer to the long wick.
Since buyers triumphed in that sense, the likelihood exists that the strength of the buyers will endure and, if that is the case, the price will rise.
In cases where the long wick is above the body of the candle, the opposite scenario might play out and the price would fall.
So how can a trader effectively make use of this in their trading?
As I always point out, a trader must first take note of the direction of the trend on the Daily chart. If the trend is down, as it is on the pair above, seeing one, or several candles for that matter, with long wicks on their tops would point toward a strong potential for price to move down – the direction that the market has already been taking the pair.
So, to continue using an example of a downtrend, if the pair retraces, that is, move against the trend and stalls at a level of resistance or Fib level, I am going to be looking for long wicks at the tops of the candles.
There are two reasons for this:
1) Those long wicks indicate the potential for the pair to trade to the downside back in the direction of the Daily trend as the retracement has stalled.
2) The top of the extended wicks provide an excellent guide for a trader to place their stop. The rationale here is that the buyers pushed price to the top of that wick but could not push it beyond that point. As such, placing the stop just above that wick represents a level that has a much lower likelihood of getting hit.
Bottom Line
Observing long wicks forming at levels of support or resistance, especially when they signal potential movement in the direction of the daily trend, can create a beneficial “edge” for the trader, especially in regard to stop placement.
Remember – anytime you try out anything new, be sure to try it out numerous times in a demo account until you achieve a level of comfort and understanding.