


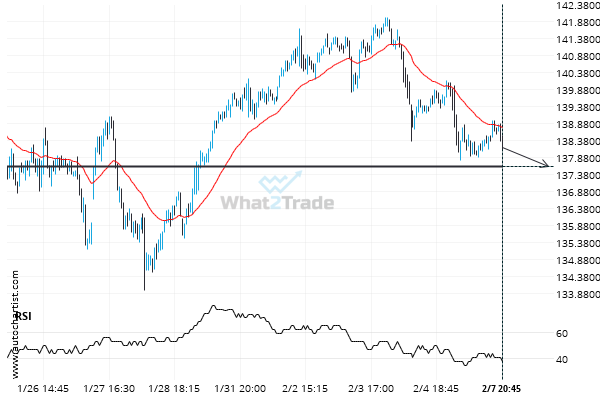
USD/JPY has broken through the resistance line of a Triangle technical chart pattern. Because we have seen it retrace from this line in the past, one should wait for confirmation of the breakout before taking any action. It has touched this line twice in the last 11 days and suggests a possible target level to be around 115.7435 within the next 2 days.
Related Posts

Breach of 1.2545 could mean a start of a bullish trend on GBP/USD
GBP/USD has broken through a resistance line. Because we have seen it retrace from this price in the…

EUR/USD may be on a start of a new bullish trend after its breakout through this important resistance level
EUR/USD has broken through a resistance line. Because we have seen it retrace from this price in the…

USD/CHF has broken through resistance of a Triangle. It has touched this line at least twice in the last 15 days.
USD/CHF has broken through a resistance line of a Triangle and suggests a possible movement to 0.9129 within…