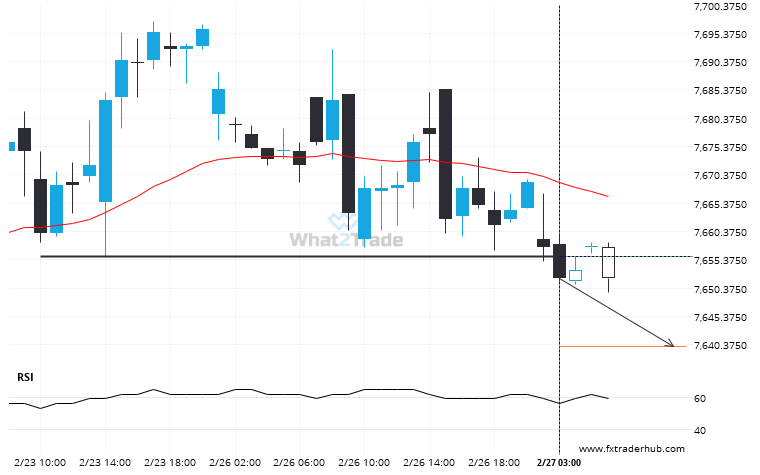
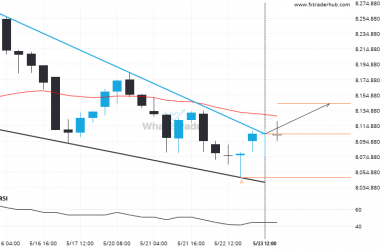
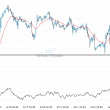
UK100 is once again retesting a key horizontal support level at 7656.0000. It has tested this level 4 times in the recent past and could simply bounce off like it did last time. However, after this many tries, maybe it’s ready to start a new trend.
Related Posts
An unexpected large move has occurred on US30 1 hour chart! Is this a sign of something new? What can we expect?
US30 has moved lower by 1.79% from 39863.0 to 39151.0 in the last 8 hours.
Interesting opportunity on FRA40 after breaking 8104.25
FRA40 has broken through the resistance line of a Falling Wedge technical chart pattern. Because we have seen…
UK100 has broken out from the Triangle pattern. Expect it to hit 8419.2945 soon.
This trade setup on UK100 is formed by a period of consolidation; a period in which the price…