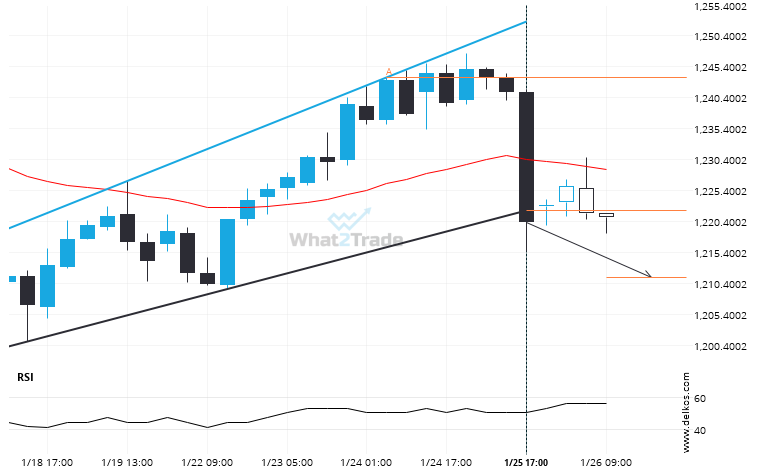
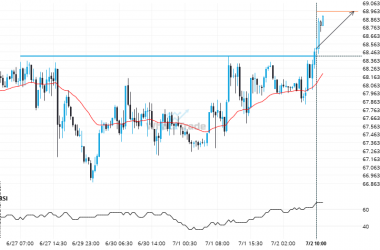
Soybeans March 2024 has broken through the support line of a Flag technical chart pattern. Because we have seen it retrace from this line in the past, one should wait for confirmation of the breakout before taking any action. It has touched this line twice in the last 14 days and suggests a possible target level to be around 1211.3279 within the next 12 hours.
Related Posts
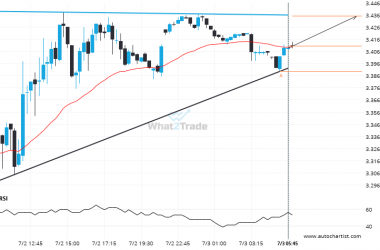
Natural Gas is approaching a resistance line of a Ascending Triangle. It has touched this line numerous times in the last 2 days.
Natural Gas is heading towards the resistance line of a Ascending Triangle and could reach this point within…
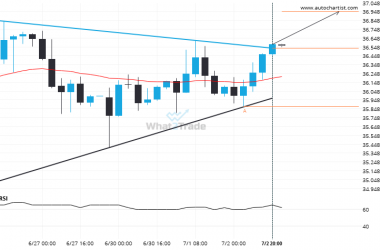
After testing resistance twice in the past, Silver Spot has finally broken through. Can we expect a bullish trend to follow?
You would be well advised to confirm the breakout that has just occurred – do you believe the…
Brent Crude has broken through a resistance line. It has touched this line numerous times in the last 6 days.
A strong resistance level has been breached at 68.4115 on the 30 Minutes Brent Crude chart. Technical Analysis…

