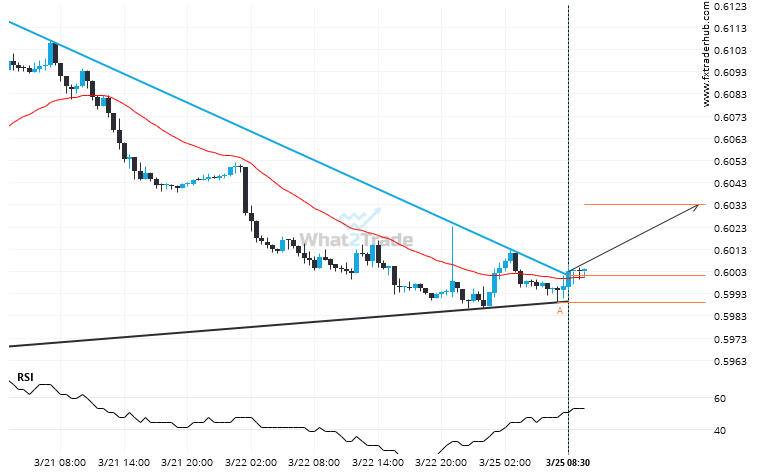
NZD/USD moved through the resistance line of a Triangle at 0.6001140229885056 on the 30 Minutes chart. This line has been tested a number of times in the past and this breakout could mean an upcoming change from the current trend. It may continue in its current direction toward 0.6033.
Related Posts
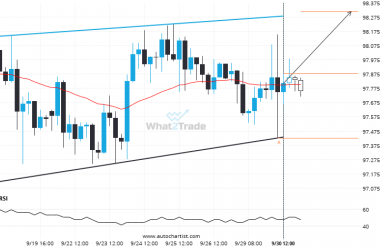
Because AUDJPY formed a Channel Up pattern, we expect it to touch the resistance line. If it breaks through resistance it may move much higher
A Channel Up pattern was identified on AUDJPY at 97.879, creating an expectation that it may move to…
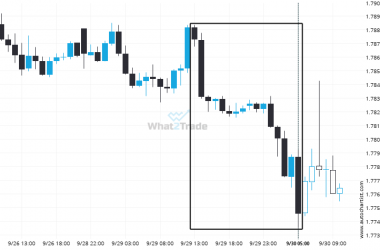
EURAUD moves lower to 1.77531 in the last 16 hours.
An unexpected large move occurred on EURAUD 1 hour chart, starting at 1.78805 and reaching 1.77531. It stands…
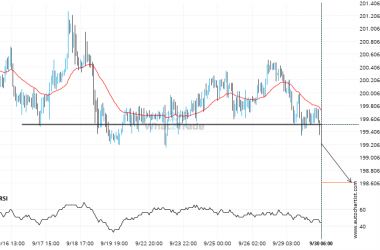
GBPJPY has broken through a support line. It has touched this line numerous times in the last 14 days.
GBPJPY has broken through a line of 199.5125 and suggests a possible movement to 198.6128 within the next…

