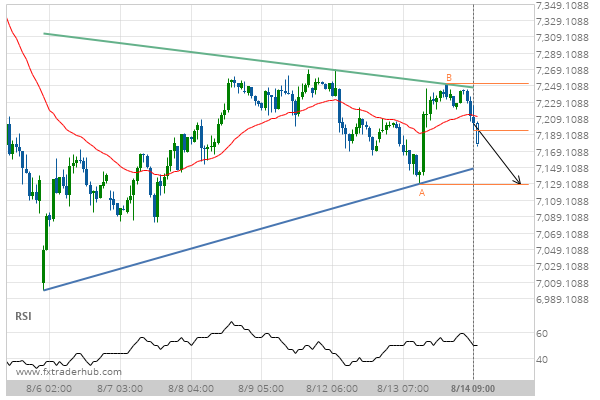
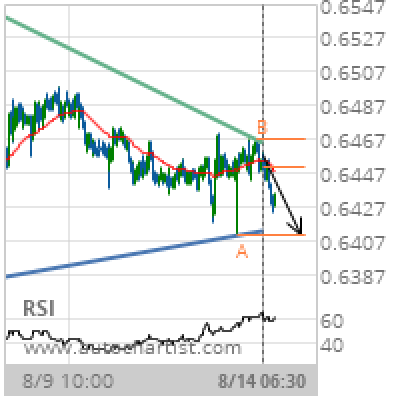

Triangle identified at 14-Aug-2019 06:30 UTC. This pattern is still in the process of forming. Possible bearish price movement towards the support 0.6411 within the next 2 days. Supported by RSI above 60
Chart 30 Minutes
Pattern Triangle
Length 303 Candles
Identified 14-Aug-2019 06:30 UTC