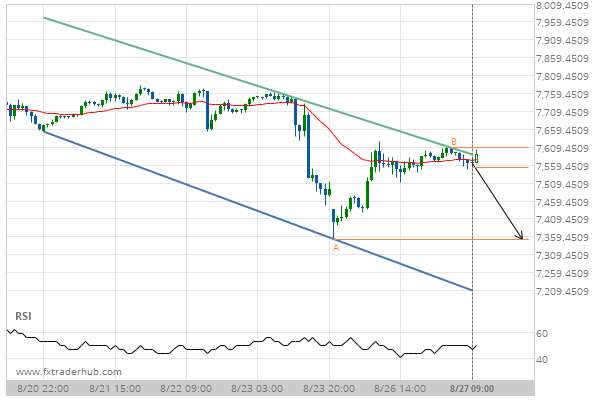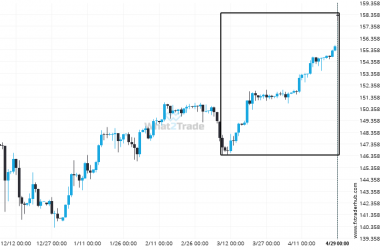
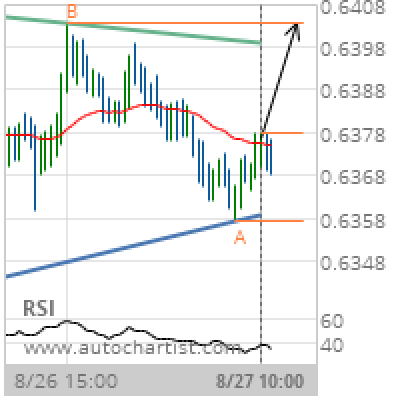

Triangle identified at 27-Aug-2019 10:00 UTC. This pattern is still in the process of forming. Possible bullish price movement towards the resistance 0.6403 within the next 13 hours. Supported by RSI below 40
Chart 30 Minutes
Pattern Triangle
Length 84 Candles
Identified 27-Aug-2019 10:00 UTC