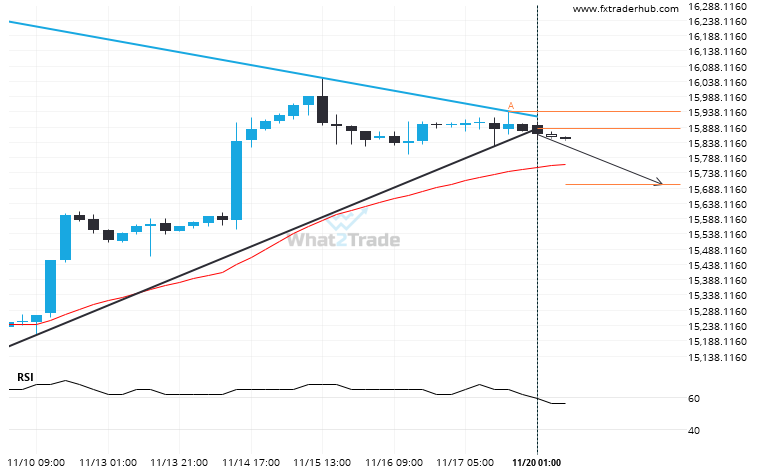
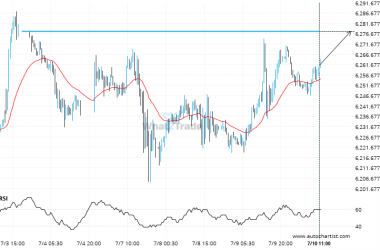
NAS100 moved through the support line of a Triangle at 15882.9140625 on the 4 hour chart. This line has been tested a number of times in the past and this breakout could mean an upcoming change from the current trend. It may continue in its current direction toward 15699.8668.
Related Posts
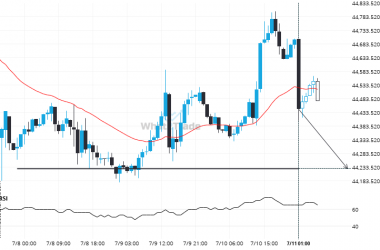
After testing 44227.1914 numerous times, DOW 30 is once again approaching this price point. Can we expect a bearish trend to follow?
The movement of DOW 30 towards 44227.1914 price line is yet another test of the line it reached…
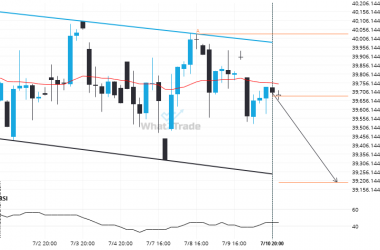
Nikkei 225 formed a Channel Down on the 4 hour chart. Retest of support in sight.
An emerging Channel Down has been detected on Nikkei 225 on the 4 hour chart. There is a…
US 500 is approaching 6277.8501. We expect either a breakout through this line, or a rebound.
US 500 is en route to a very important line that will be a definite deciding factor of…

