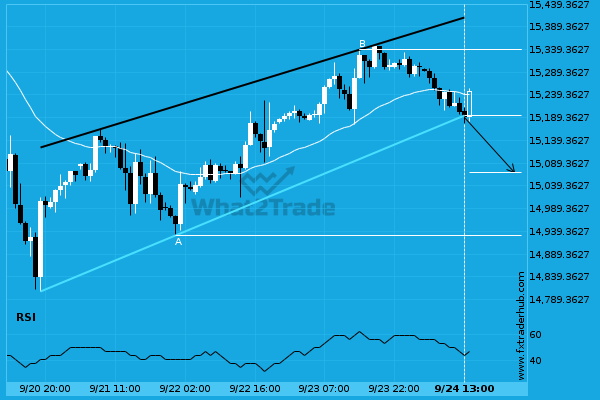
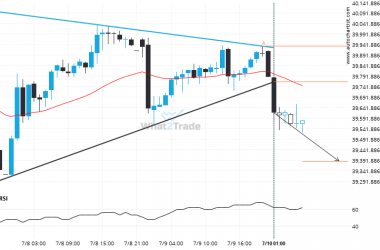
NAS100 has broken through the support line of a Channel Up technical chart pattern. Because we have seen it retrace from this position in the past, one should wait for confirmation of the breakout before trading. It has touched this line twice in the last 4 days and suggests a target line to be around 15069.2480 within the next 2 days.
Related Posts
Nikkei 225 formed a Channel Down on the 4 hour chart. Retest of support in sight.
An emerging Channel Down has been detected on Nikkei 225 on the 4 hour chart. There is a…
US 500 is approaching 6277.8501. We expect either a breakout through this line, or a rebound.
US 500 is en route to a very important line that will be a definite deciding factor of…
A possible move by Nikkei 225 towards 39385.2769
The last 3 1 hour candles on Nikkei 225 formed a Triangle pattern and broken out through the…

