
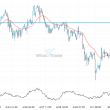
LTCUSD has broken through the support line of a Triangle technical chart pattern. Because we have seen it retrace from this line in the past, one should wait for confirmation of the breakout before taking any action. It has touched this line twice in the last 7 days and suggests a possible target level to be around 96.3857 within the next 2 days.
Related Posts
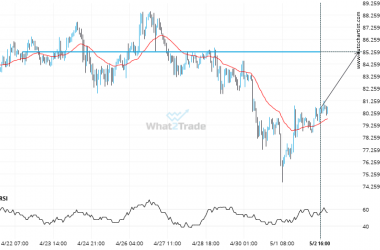
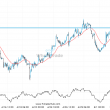
LTCUSD seems to be on its way to resistance – a possible opportunity?
LTCUSD is moving towards a key resistance level at 85.2300. LTCUSD has previously tested this level 4 times…
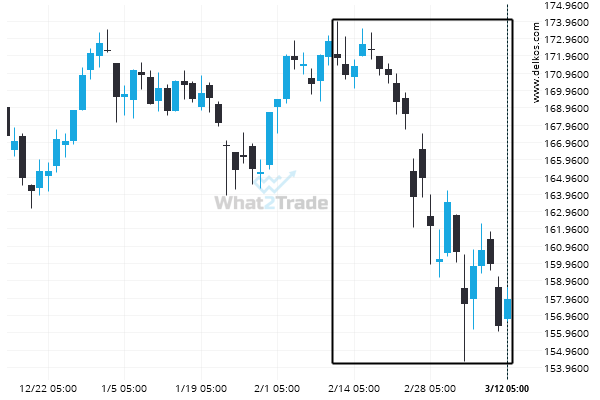
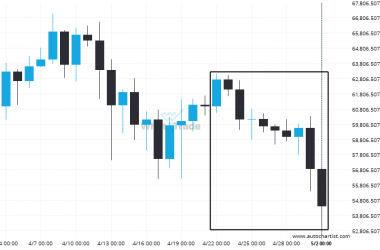
Extreme movement experienced on BTCJPY. Check this chart to see what to do next
BTCJPY has experienced an exceptionally large movement lower by 11.52% from 10301505.05 to 9114333.12 in the last 10…
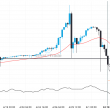
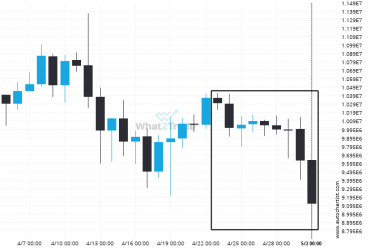
BTCEUR moves lower to 54381.86 in the last 11 days.
BTCEUR has experienced an exceptionally large movement lower by 13.34% from 62752.58 to 54381.86 in the last 11…