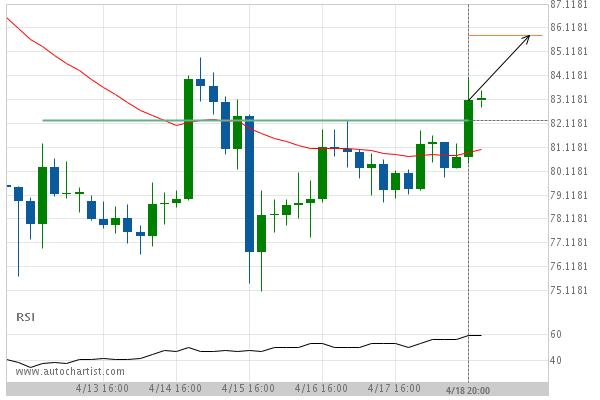
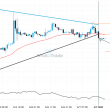
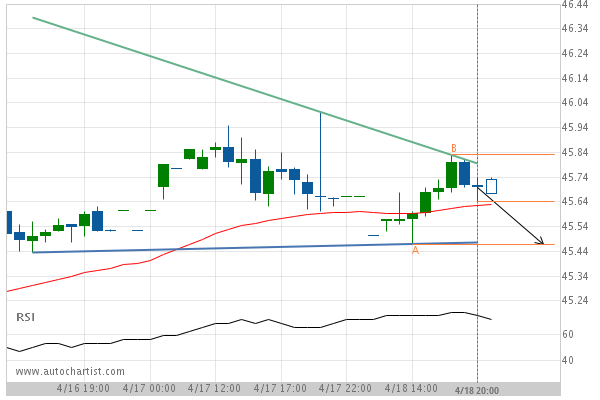
Descending Triangle identified at 18-Apr-2019 20:00 UTC. This pattern is still in the process of forming. Possible bearish price movement towards the support 45.47 within the next 10 hours.
Ishares Trust Ftse/Xinhua China 25 Inde Target Level: 45.47

Descending Triangle identified at 18-Apr-2019 20:00 UTC. This pattern is still in the process of forming. Possible bearish price movement towards the support 45.47 within the next 10 hours.