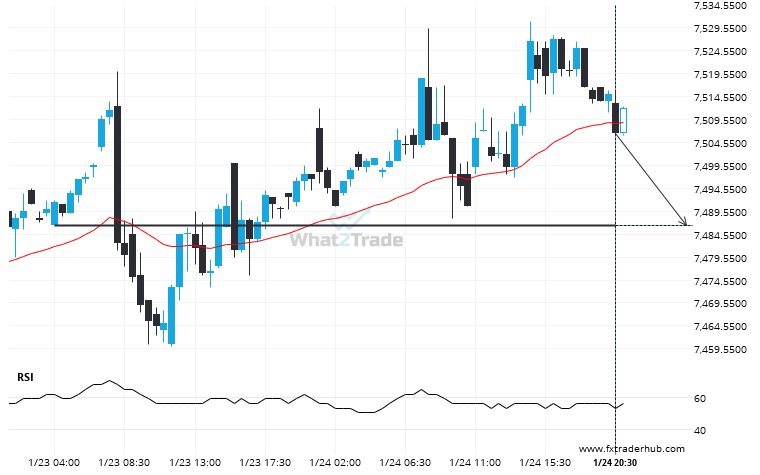
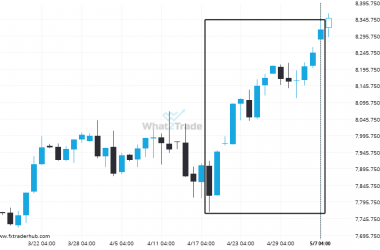
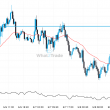
UK100 is moving towards a key support level at 7486.5000. UK100 has previously tested this level 3 times and on each occasion it has bounced back off this level. Is this finally the time it will break through?
Related Posts
Bulls aim for 8206.1736 after the FRA40 triggered a bullish formation on the Daily chart
Triangle pattern identified on FRA40 has broken through a resistance level with the price momentum continuing to move…
Extreme movement experienced on UK100. Check this chart to see what to do next
A movement of 6.41% over 20 days on UK100 doesn’t go unnoticed. You may start considering where it’s…
Bulls aim for 8197.1608 after the FRA40 triggered a bullish formation on the 4 hour chart
FRA40 has broken through a resistance line of a Triangle chart pattern. If this breakout holds true, we…