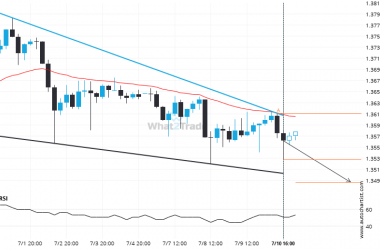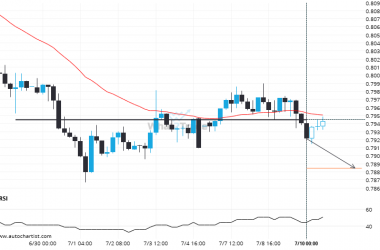
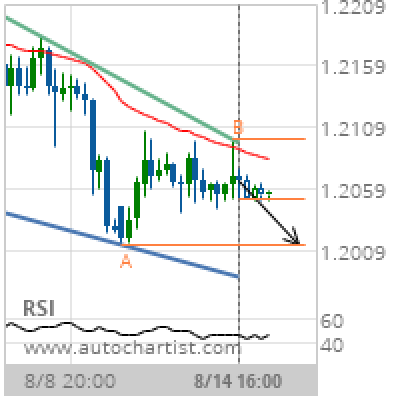

Falling Wedge identified at 14-Aug-2019 16:00 UTC. This pattern is still in the process of forming. Possible bearish price movement towards the support 1.2014 within the next 2 days. Supported by Downward sloping Moving Average
Chart 4 hour
Pattern Falling Wedge
Length 56 Candles
Identified 14-Aug-2019 16:00 UTC