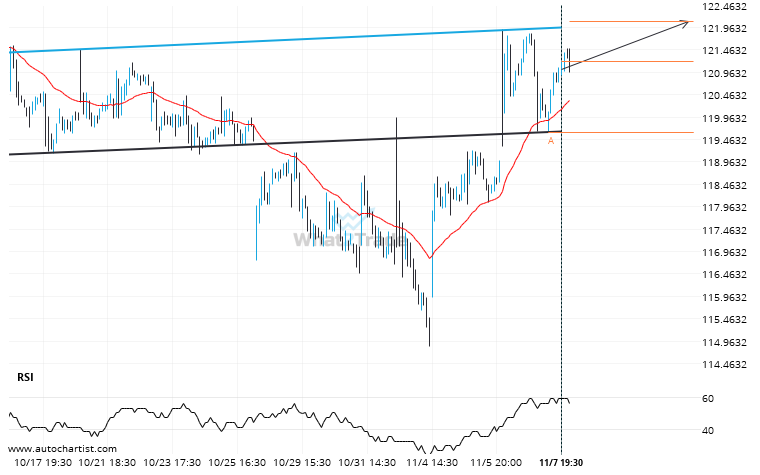

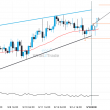
Emerging Inverse Head and Shoulders pattern in its final wave was identified on the XOM 30 Minutes chart. After a strong bullish run, we find XOM heading towards the upper triangle line with a possible resistance at 122.1002. If the resistance shows to hold, the Inverse Head and Shoulders pattern suggests a rebound back towards current levels.
XOM is quickly approaching the resistance line of a Inverse Head and Shoulders. We expect either a breakout through this line or a rebound.