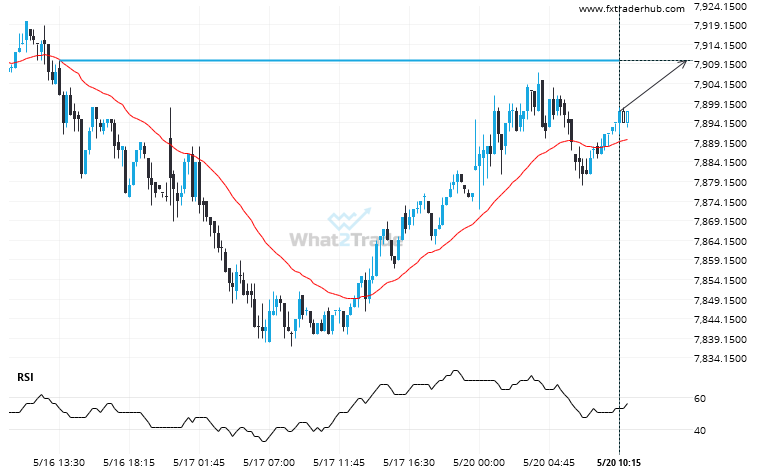
The price of AUS200 in heading back to the resistance area. It is possible that it will struggle to break through it and move back in the other direction. The price may eventually break through, but typically the price retreats from the level a number of times before doing so.
Related Posts
Rare bullish streak on the ASX 200 Daily chart.
ASX 200 posted a high rate of consecutive bullish candles on the Daily chart.
After testing 7892.2002 numerous times, CAC 40 has finally broken through. Can we expect a bullish trend to follow?
CAC 40 has broken through 7892.2002 which it has tested numerous times in the past. We have seen…
US 500 through 6451.963030303029. Is this a confirming a breakout? Will it continue its path in the current trend toward 6406.5663?
This trade setup on US 500 is formed by a period of consolidation; a period in which the…