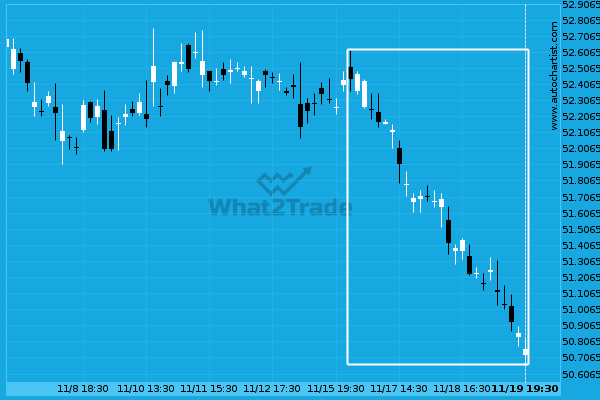
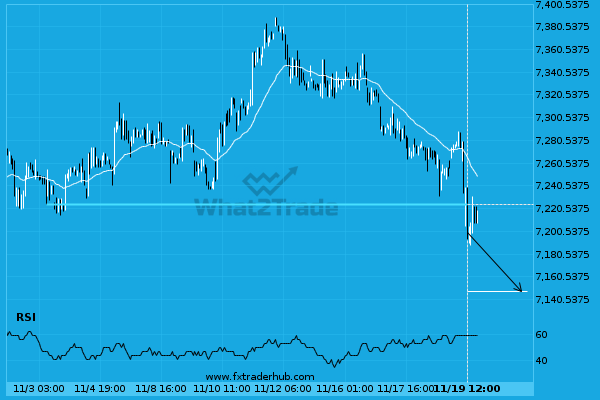
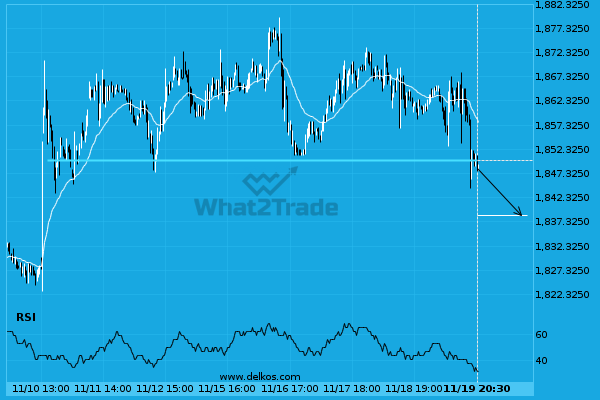
A movement of 3.19% over 4 days on Verizon Communications Inc. doesn’t go unnoticed. You may start considering where it’s heading next, a continuation of the current downward trend, or a reversal in the previous direction.
Related Posts
Extreme movement experienced on TSLA. Check the chart to see what to do next.
TSLA recorded a considerable move in the last day — one of its biggest in recent sessions.
PFE has formed 6 bullish candles in a row.
PFE experienced a high number of bullish candles reaching 27.3650 over 9 days.
If PYPL touches 70.3750 it may be time to take action.
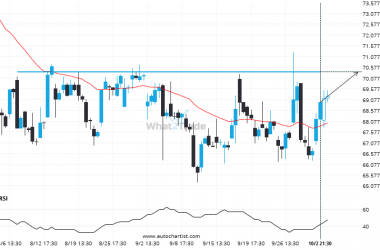
A strong resistance level has been identified at 70.3750 on the 4 hour PYPL chart. PYPL is likely…

