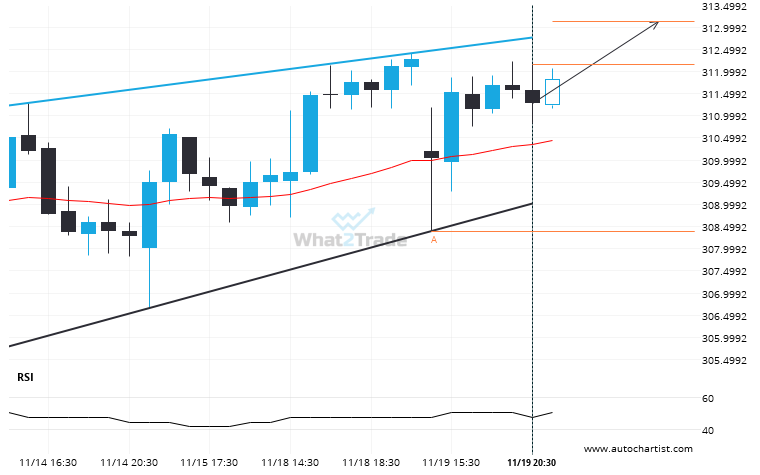
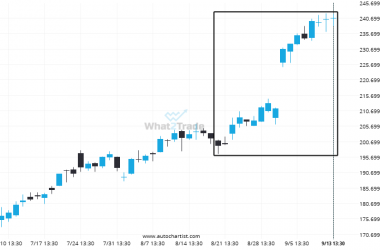
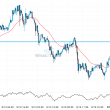
Emerging Rising Wedge pattern in its final wave was identified on the V 1 hour chart. After a strong bullish run, we find V heading towards the upper triangle line with a possible resistance at 313.1321. If the resistance shows to hold, the Rising Wedge pattern suggests a rebound back towards current levels.
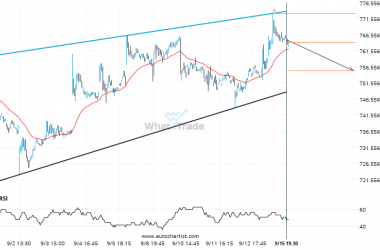
Related Posts
After trying numerous times in the past, NVDA finally breaks 115.3900!
NVDA is once again retesting a key horizontal resistance level at 115.3900. It has tested this level 3…
PFE has formed 4 bearish candles successively, what is the probability of getting another bearish candle?
Due to the rate of consecutive bearish candles on PFE Daily chart we could be in for a…
AMD is approaching a support line of a Rising Wedge. It has touched this line numerous times in the last 42 days.
AMD is heading towards the support line of a Rising Wedge. If this movement continues, the price of…