You’re about to ride a bullish trend; you plan your stop loss and gauge how much you can risk. You also know the rule of thumb—that is that your profit should be at least twice the amount you are willing to risk. But how can you know if the trade you’re considering really has potential that is worth twice the risk? The Fibonacci Expansion is a great tool that allows you to assess the potential of a bullish trend, especially when used with other indicators.
Drawing the Fibonacci Expansion
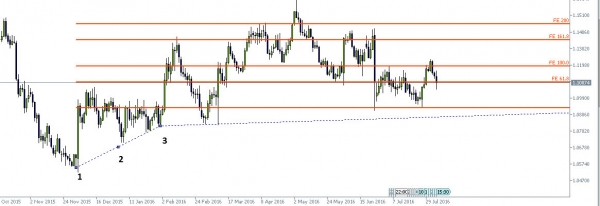
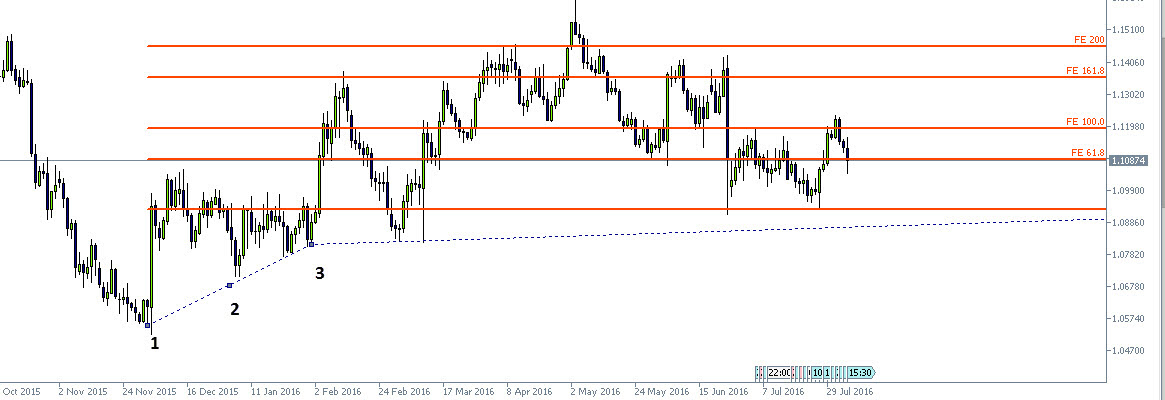
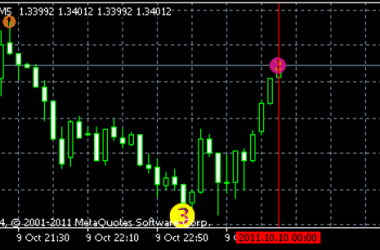
The Fibonacci Expansion on a MetaTrader trend line has three dots yet only the first and third are really worth your focus. The first dot has to be placed at the beginning of the first wave in our expansion wave and the third dot should be placed at the beginning of the second wave.
Caution: One of the biggest pitfalls in the Fibonacci Expansion is the failure to recognize the second wave. The second wave can only be considered a second wave if it is higher than the first; if it did not create a new high, it’s either not the second wave or, worse, there’s no expansion.
After the Fibonacci Expansion has been drawn, we can see the various levels of possible resistance. It is important to notice that, indeed, the various levels of Fibonacci are acting as resistance levels, especially the 61.8% and the 161.8%. If the Fibonacci levels and resistance levels do not align on key levels, the Fibonacci Expansion was drawn incorrectly.
Setting your Limit
When the Fibonacci levels are overlaid, you can get an indication on possible targets for your trend and can decide accordingly on which level to place your limit. If the limit is more than twice the distance in pips to your stop loss, that is a confirmation that the trade is worthwhile.
Now you are left with a key decision: where is the potential limit for this trade? That will depend on your degree of conservatism, i.e. your risk threshold. For example, placing your stop loss at the 200% level is somewhat aggressive. If you have to place your limit on that level to gain twice what you are risking, you are taking quite a chance because there is no margin of safety. But if you set your limit at 161.8% and that gives you twice what you are risking, then there is more margin for safety, and the pair is more likely to fit the 161.8% level than it is the 200%. If the pair surges beyond the 200% level you can repeat the drawing process and stretch a new line and get a new potential target.
Rules to Remember
The biggest risk with Fibonacci, whether it’s expansion or retracement, is that if you stretch it wrong, your entire strategy can go wrong, including your potential target. One way to avoid such a pitfall is to use the second wave rule of thumb. Another way to minimize risk is to calibrate Fibonacci using Parabolic SAR. It is also important to remember that, just like any other trend or support line, the higher you go on the intervals – daily, weekly, monthly – the more accurate it is likely to be (and vice versa, of course). Lastly, and perhaps the most important thing, is the understanding that Fibonacci does not determine trend—YOU must determine whether or not the trend is, indeed, bullish before considering the Fibonacci expansion as accurate.


