Receive the latest alerts via email

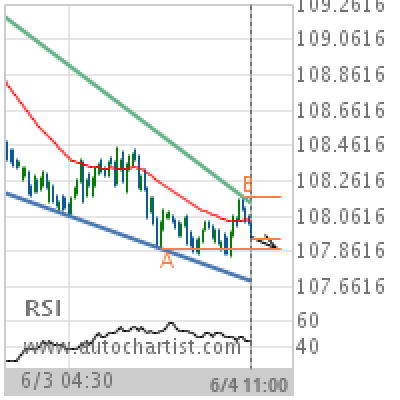
USD/JPY Target Level: 107.8800

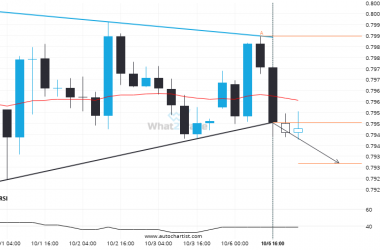
Falling Wedge identified at 04-Jun-2019 11:00 UTC. This pattern is still in the process of forming. Possible bearish price movement towards the support 107.8800 within the next 23 hours. Supported by Downward sloping Moving Average Chart 30 MinutesPattern Falling WedgeLength 138 CandlesIdentified 04-Jun-2019 11:00 UTC
USD/JPY Target Level: 107.8800

Falling Wedge identified at 04-Jun-2019 11:00 UTC. This pattern is still in the process of forming. Possible bearish price movement towards the support 107.8800 within the next 23 hours. Supported by Downward sloping Moving Average

Chart 30 Minutes
Pattern Falling Wedge
Length 138 Candles
Identified 04-Jun-2019 11:00 UTC

Total
0
Shares
Previous Post

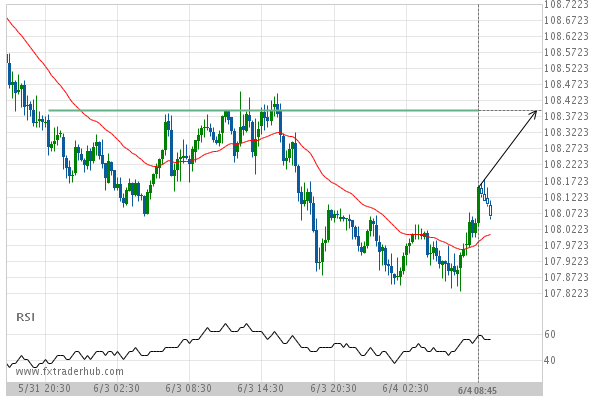
USD/JPY is quickly approaching 108.3930. We expect either a breakout through this line, or a rebound.

Next Post

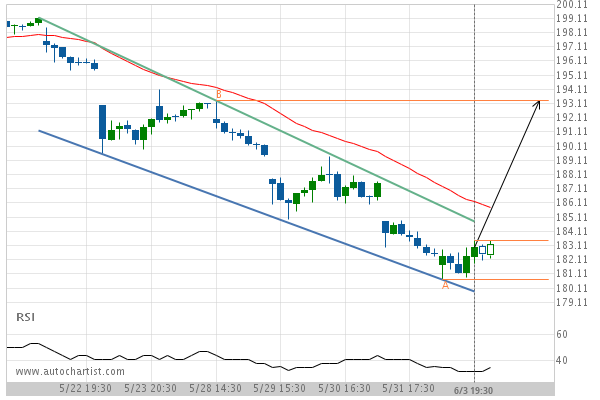
After testing the resistance line numerous times, Goldman Sachs Group Inc. is once again approaching this line. Can we expect a bullish trend to follow?

Related Posts