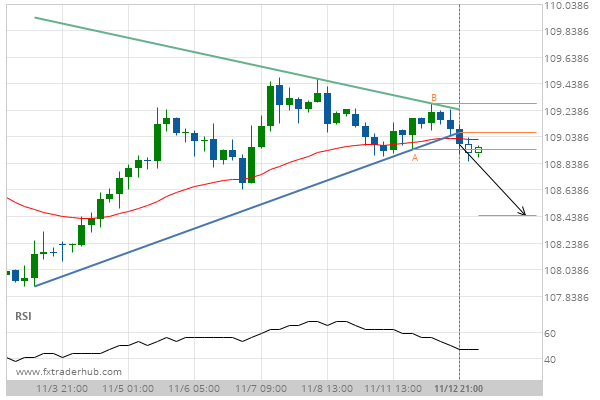
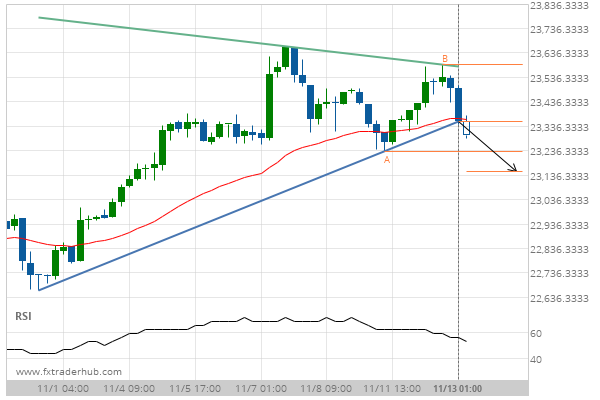
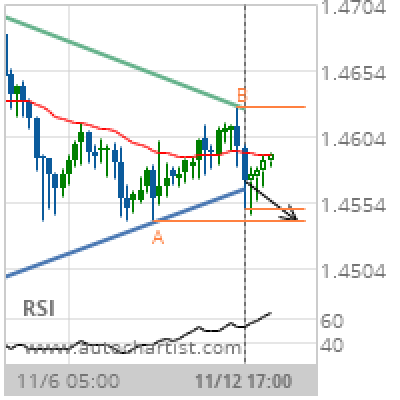
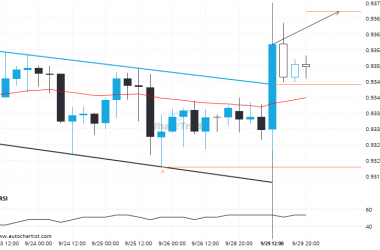
USD/JPY has broken through the support line of a Triangle. It has touched this line at least twice in the last 12 days. This breakout indicates a potential move to 108.4437 within the next 3 days. Because we have seen it retrace from this positions in the past, one should wait for confirmation of the breakout before trading.
Related Posts
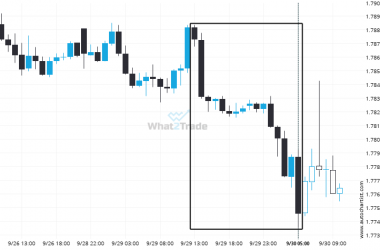
EURAUD moves lower to 1.77531 in the last 16 hours.
An unexpected large move occurred on EURAUD 1 hour chart, starting at 1.78805 and reaching 1.77531. It stands…
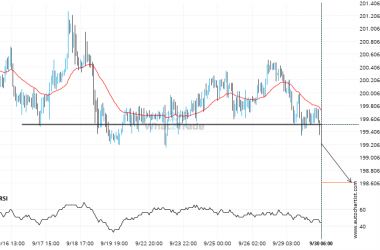
GBPJPY has broken through a support line. It has touched this line numerous times in the last 14 days.
GBPJPY has broken through a line of 199.5125 and suggests a possible movement to 198.6128 within the next…
A possible move by EURCHF towards 0.9369
The last 7 4 hour candles on EURCHF formed a Channel Down pattern and broken out through the…

