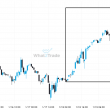
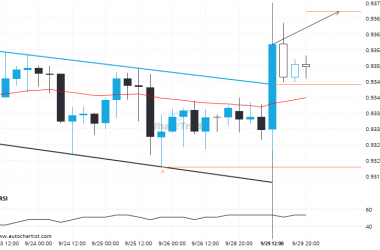
USD/JPY moved through the support line of a Rising Wedge at 148.20055555555555 on the 4 hour chart. This line has been tested a number of times in the past and this breakout could mean an upcoming change from the current trend. It may continue in its current direction toward 146.9130.
Related Posts
Interesting opportunity on EURCHF after breaking 0.9389486923076923
EURCHF has broken through a resistance line. It has touched this line at least twice in the last…
Rare set of bullish consecutive candles on the GBPCHF Daily chart. Can we expect a turn-around?
GBPCHF has moved higher after 5 consecutive daily candles from 1.0954 to 1.1169 in the last 7 days.
After testing 0.6467 numerous times, AUDUSD has finally broken through. Can we expect a bullish trend to follow?
AUDUSD is once again retesting a key horizontal resistance level at 0.6467. It has tested this level 4…