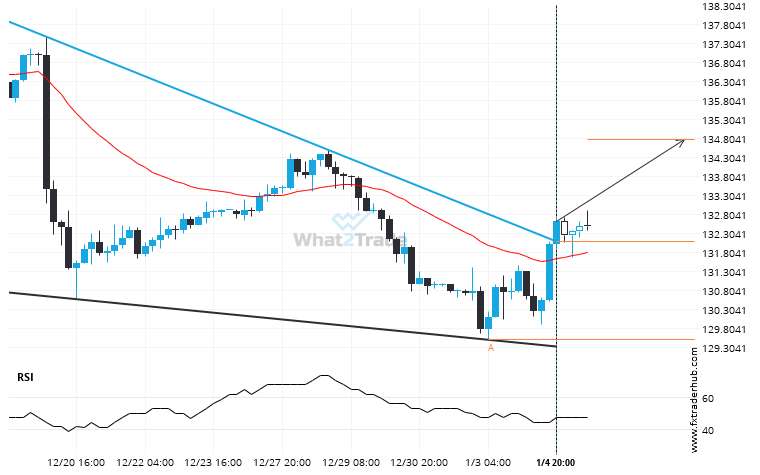
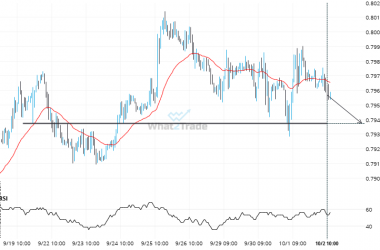
USD/JPY has broken through a resistance line. It has touched this line at least twice in the last 23 days. This breakout may indicate a potential move to 134.7836 within the next 3 days. Because we have seen it retrace from this position in the past, one should wait for confirmation of the breakout before trading.
Related Posts
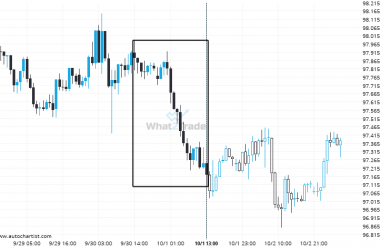
AUDJPY – Large moves like this tend to draw attention.
AUDJPY reached 97.175 after a 0.72% move spanning 23 hours.
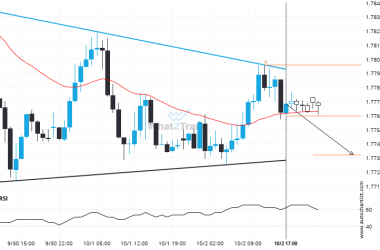
EURAUD is quickly approaching the support line of a Triangle. We expect either a breakout through this line or a rebound.
Emerging Triangle pattern in its final wave was identified on the EURAUD 1 hour chart. After a strong…
If you’re long USDCHF you should be aware of the rapidly approaching level of 0.7937
USDCHF is about to retest a key horizontal support level near 0.7937. It has tested this level 5…

