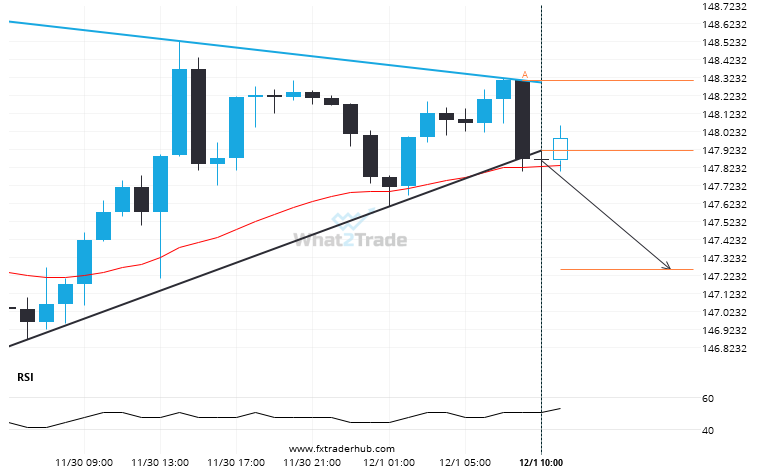
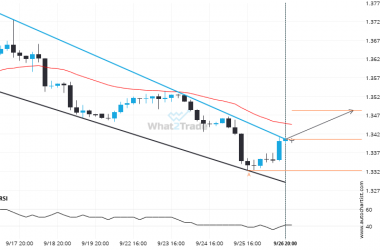
The last 3 1 hour candles on USD/JPY formed a Triangle pattern and broken out through the pattern lines, indicating a possible bearish movement towards the price level of 147.2568.
Related Posts
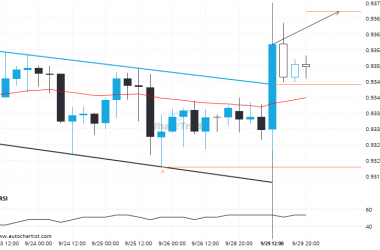
A possible move by EURCHF towards 0.9369
The last 7 4 hour candles on EURCHF formed a Channel Down pattern and broken out through the…
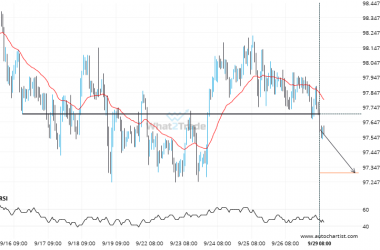
Big movement possible on AUDJPY after a breach of 97.7030
AUDJPY has broken through 97.7030 which it has tested numerous times in the past. We have seen it…
Interesting opportunity on GBPUSD after breaking 1.3407553703703703
This trade setup on GBPUSD is formed by a period of consolidation; a period in which the price…

