


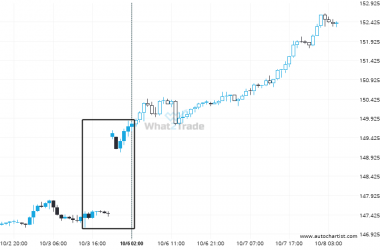
USD/JPY has broken through the resistance line of a Pennant technical chart pattern. Because we have seen it retrace from this line in the past, one should wait for confirmation of the breakout before taking any action. It has touched this line twice in the last 7 days and suggests a possible target level to be around 115.4951 within the next 10 hours.

Related Posts
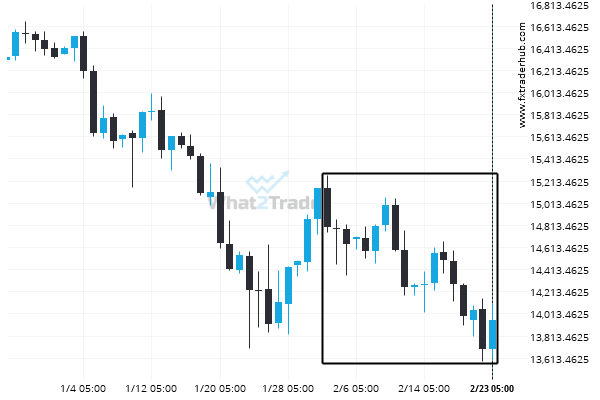
Extreme movement experienced on USDJPY. Check the chart to see what to do next.
USDJPY just posted a 1.58% move over the past 3 days – a move that won’t go unnoticed…
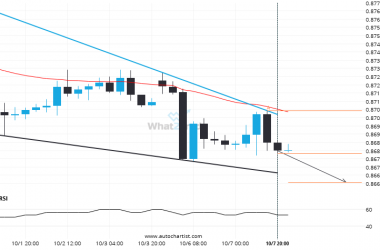
After testing the support line numerous times, EURGBP is once again approaching this line. Can we expect a bearish trend to follow?
EURGBP was identified at around 0.86786 having recently rebounded of the resistance on the 4 hour data interval.…
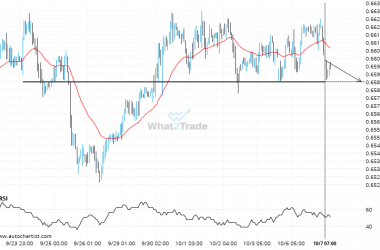
AUDUSD likely to test 0.6584 in the near future. Where to next?
AUDUSD is en route to a very important line that will be a definite deciding factor of what…