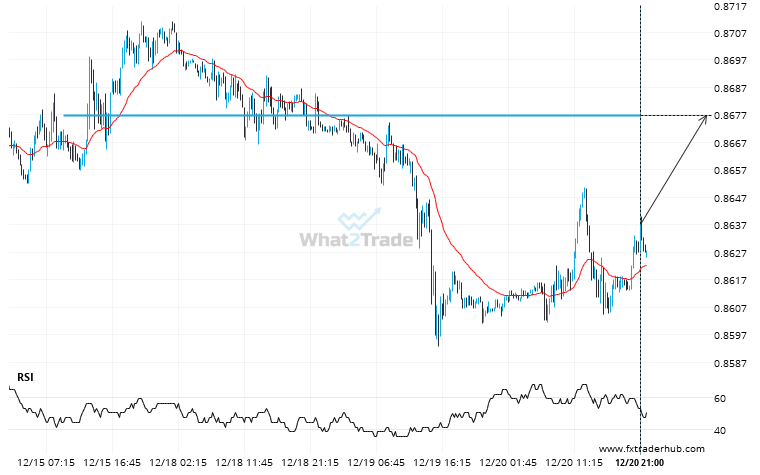
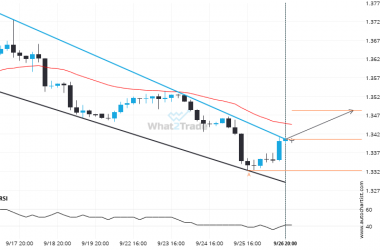
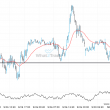
USD/CHF is heading towards 0.8677 and could reach this point within the next 20 hours. It has tested this line numerous times in the past, and this time could be no different, ending in a rebound instead of a breakout. If the breakout doesn’t happen, we could see a retracement back down to current levels.
Related Posts
GBPJPY formed a Falling Wedge on the 4 hour chart. Retest of support in sight.
The movement of GBPJPY towards the support line of a Falling Wedge is yet another test of the…
Will AUDNZD break through the resistance level it tested before?
A strong resistance level has been identified at 1.0954 on the 1 hour AUDNZD chart. AUDNZD is likely…
EURGBP through 0.8661379310344827. Is this a confirming a breakout? Will it continue its path in the current trend toward 0.8642?
EURGBP has broken through a support line of a Triangle chart pattern. If this breakout holds true, we…