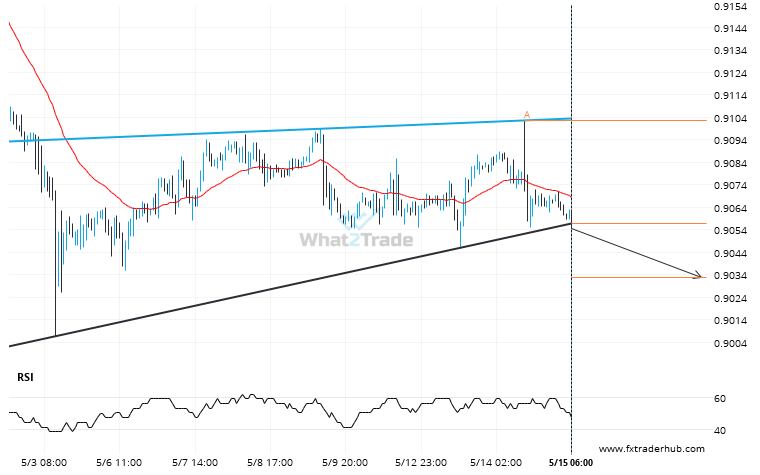
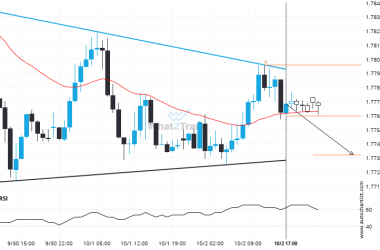
The last 15 1 hour candles on USD/CHF formed a Rising Wedge pattern and broken out through the pattern lines, indicating a possible bearish movement towards the price level of 0.9033.
USD/CHF broke through a support at 2024-05-15T07:00:00.000Z, with the price momentum continuing to move in an downward direction over the next hours, good opportunity presents itself with the price expected to reach 0.9033.