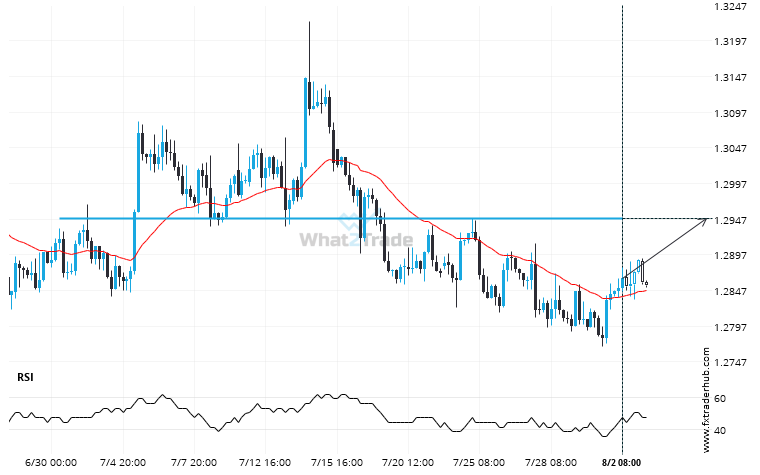
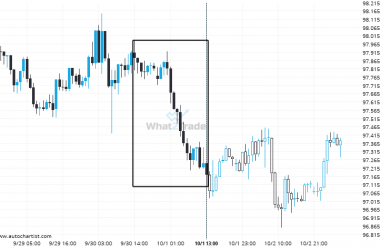
USD/CAD is approaching the resistance line of a Resistance. It has touched this line numerous times in the last 34 days. If it tests this line again, it could do so in the next 5 days.
Related Posts
Extreme movement experienced on GBPCHF. Check this chart to see what to do next
GBPCHF has moved lower by 2.81% from 1.11259 to 1.081325 in the last 35 days.
Because CHFJPY formed a Channel Up pattern, we expect it to touch the resistance line. If it breaks through resistance it may move much higher
CHFJPY was identified at around 184.348 having recently rebounded of the support on the 30 Minutes data interval.…
After testing 0.8622 numerous times, EURGBP has finally broken through. Can we expect a bearish trend to follow?
EURGBP has broken through a support line. Because we have seen it retrace from this price in the…