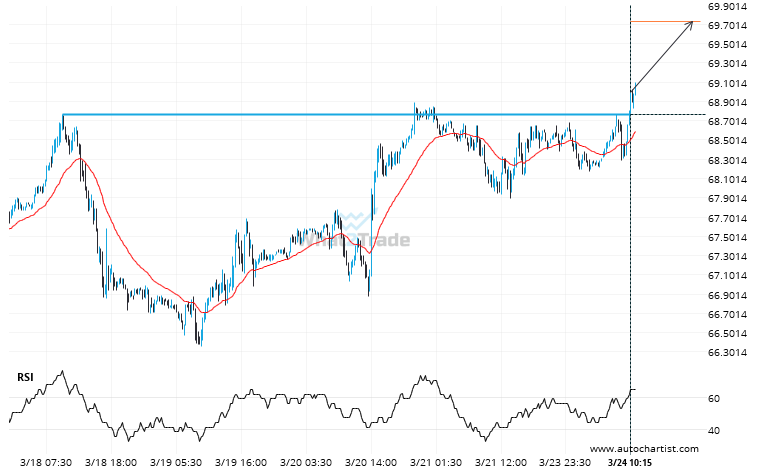
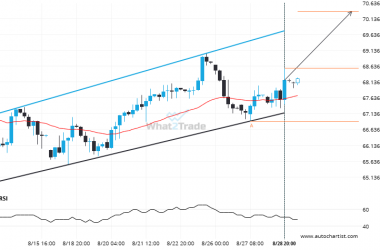
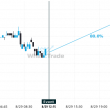
A strong resistance level has been breached at 68.7610 on the 15 Minutes US Oil chart. Technical Analysis theory forecasts a movement to 69.7326 in the next 22 hours.
Related Posts
Gold Spot broke through a resistance at 2025-06-30T18:00:00.000Z, with the price momentum continuing to move in an upward direction over the next hours, good opportunity presents itself with the price expected to reach 3336.0673.
This trade setup on Gold Spot is formed by a period of consolidation; a period in which the…
Breach of 3.5415 could mean a start of a bearish trend on Natural Gas
Natural Gas has breached the support line at 3.5415. It may continue the bearish trend towards 3.4191, or,…
Gold Spot is quickly approaching the resistance line of a Channel Down. We expect either a breakout through this line or a rebound.
Gold Spot was identified at around 3282.8995 having recently rebounded of the support on the 1 hour data…