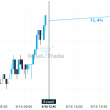
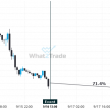
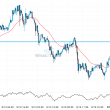
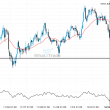
The last 16 4 hour candles on US Oil formed a Falling Wedge pattern and broken out through the pattern lines, indicating a possible bullish movement towards the price level of 71.0864.
Related Posts
Brent Crude likely to test 67.7885 in the near future. Where to next?
Brent Crude is moving towards a key resistance level at 67.7885. This is a previously tested level for…
Important price line breached by Natural Gas. This price has been tested numerous times before.
Natural Gas has breached the resistance line at 2.9680. It may continue the bullish trend towards 3.1010, or,…
Natural Gas through 2.9335. Is this a confirming a breakout? Will it continue its path in the current trend toward 3.0254?
Natural Gas has broken through the resistance line which it has tested twice in the past. We have…

