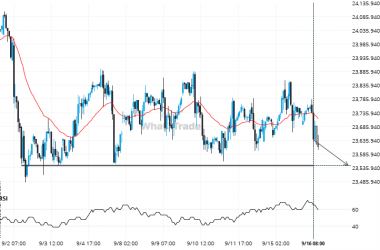
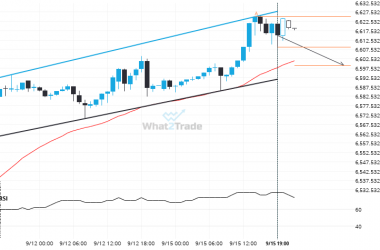
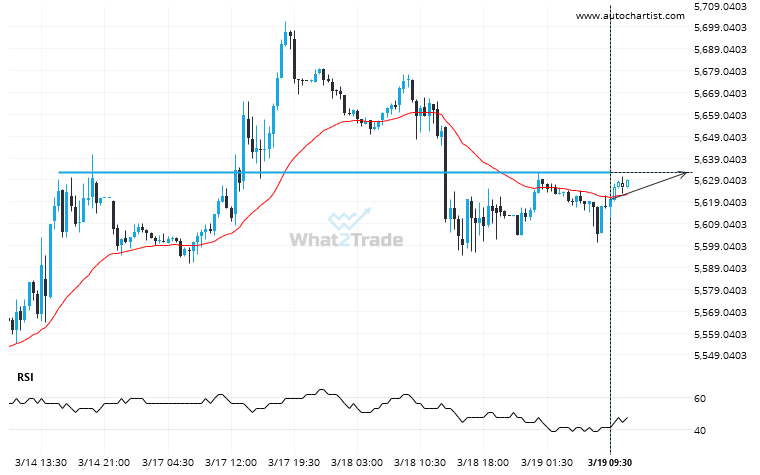
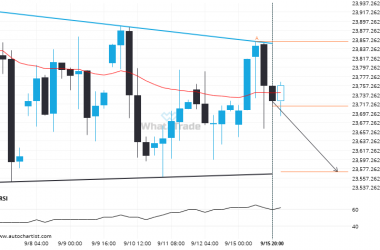
A strong resistance level has been identified at 5632.2500 on the 30 Minutes US 500 chart. US 500 is likely to test it soon.
Related Posts
An unexpected large move has occurred on FTSE 100 Daily chart! Is this a sign of something new? What can we expect?
For those of you that don’t believe in trends, this may be an opportunity to take advantage of…
NAS 100 formed a Channel Up on the 4 hour chart. Retest of resistance in sight.
An emerging Channel Up has been detected on NAS 100 on the 4 hour chart. There is a…
After testing 21409.7012 numerous times, NAS 100 is once again approaching this price point. Can we expect a bullish trend to follow?
NAS 100 is moving towards a line of 21409.7012 which it has tested numerous times in the past.…