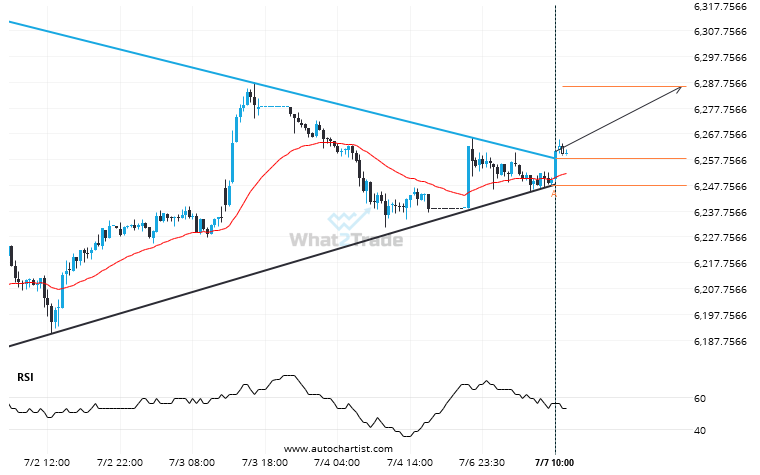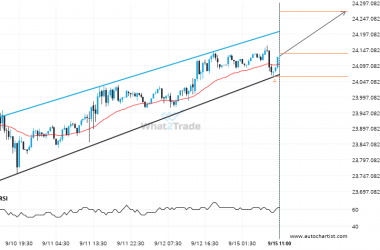
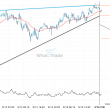
US 500 has broken through a resistance line of a Triangle chart pattern. If this breakout holds true, we may see the price of US 500 testing 6286.2379 within the next 21 hours. But don’t be so quick to trade, it has tested this line in the past, so you should confirm the breakout before taking any action.
US 500 has broken through resistance of a Triangle. It has touched this line at least twice in the last 6 days.