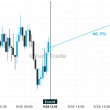
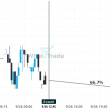
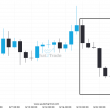
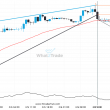
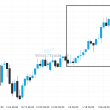
An unexpected large move has occurred on UK100 1 hour chart beginning at 7584.5 and ending at 7665.0. Is this a sign of something new? What can we expect in the future?
Related Posts
Nikkei 225 may be on a start of a new bearish trend after its breakout through this important support level
Nikkei 225 is once again retesting a key horizontal support level at 45225.0000. It has tested this level…
DOW 30 has broken through resistance of a Falling Wedge. It has touched this line at least twice in the last 3 days.
The breakout of DOW 30 through the resistance line of a Falling Wedge could be a sign of…
A final push possible on DAX 40 as it starts approaching a price line of 23706.9004.
DAX 40 is moving towards a line of 23706.9004 which it has tested numerous times in the past.…

