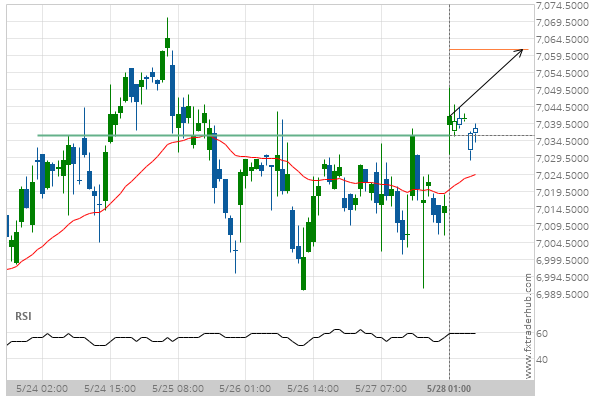
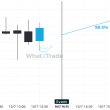
UK100 has broken through the resistance line of a Resistance. It has touched this line numerous times in the last 5 days. This breakout shows a potential move to 7061.1499 within the next 14 hours. Because we have seen it retrace from this position in the past, one should wait for confirmation of the breakout before trading.
UK100 has broken through the resistance line of a Resistance. It has touched this line numerous times in the last 5 days.