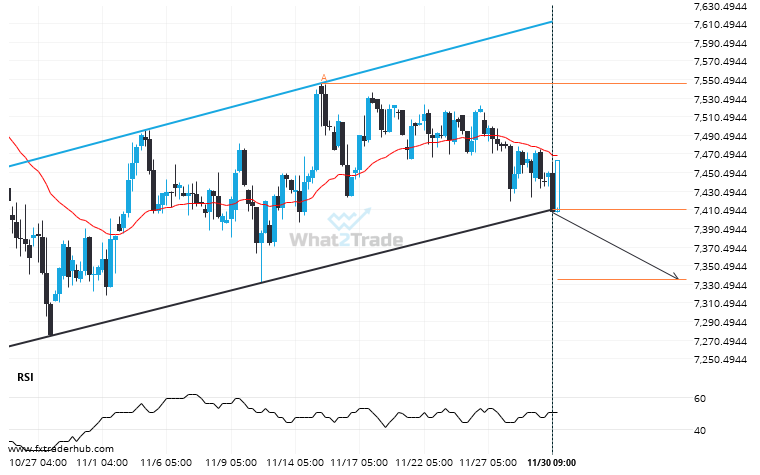
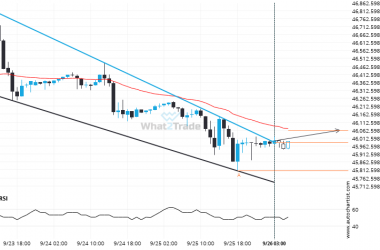
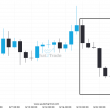
UK100 has broken through the support line of a Channel Up technical chart pattern. Because we have seen it retrace from this line in the past, one should wait for confirmation of the breakout before taking any action. It has touched this line twice in the last 44 days and suggests a possible target level to be around 7335.5893 within the next 7 days.
Related Posts
Supports and resistances are primary concepts of technical analysis. US 500 is heading for an important price of 5516.8198 – read about what this could mean for the future.
US 500 is moving towards a line of 5516.8198 which it has tested numerous times in the past.…
Is the extremely large movement on US 500 a sign of things to come?
US 500 experienced an extremely large move that lasted 10. This movement is in the 97.0 percentile and…
A Triangle has formed, ASX 200 is approaching resistance. Can we expect a breakout and the start of a new trend or a reversal?
A Triangle pattern was identified on ASX 200 at 7720.0, creating an expectation that it may move to…