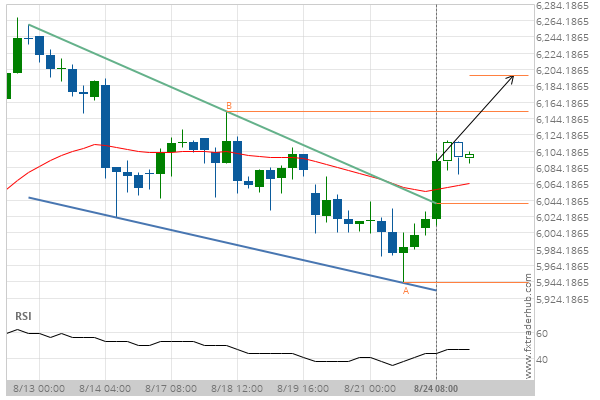
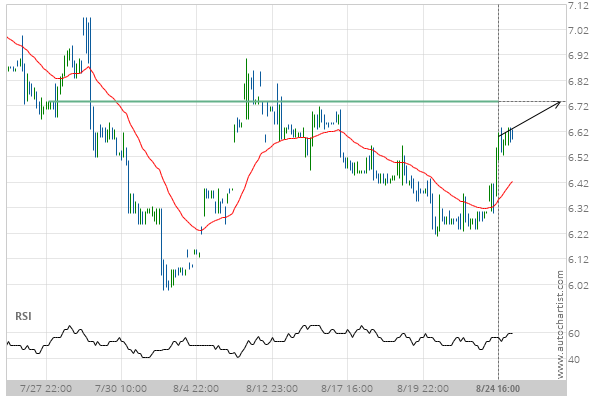
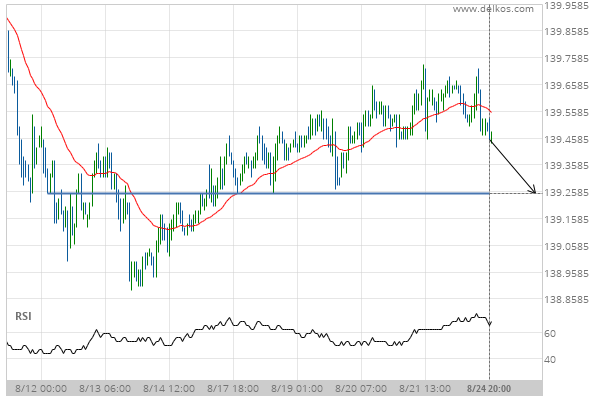
UK100 has broken through the resistance line of a Falling Wedge technical chart pattern. Because we have seen it retrace from this position in the past, one should wait for confirmation of the breakout before trading. It has touched this line twice in the last 12 days and suggests a target line to be around 6196.7014 within the next 2 days.
Related Posts
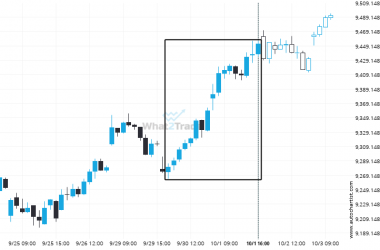
FTSE 100 reached 9451.85 after a 1.84% move spanning 2 days.
FTSE 100 recorded a considerable move in the last day — one of its biggest in recent sessions.
Big bullish swing on DAX 40 – this may be one of its more notable movements in the recent session.
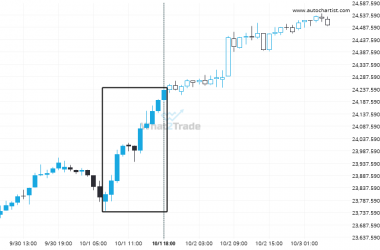
DAX 40 reached 24232.6 after a 1.77% move spanning 11 hours.
DOW 30 is signaling a possible trend reversal on the intraday charts with price not breaching resistance.
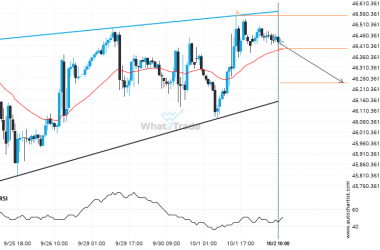
DOW 30 was identified at around 46395.84 having recently rebounded of the resistance on the 1 hour data…


