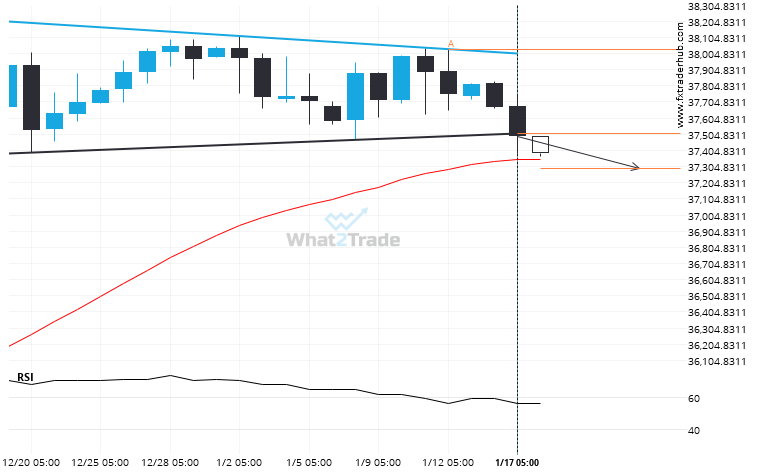
US30 moved through the support line of a Triangle at 37510.0 on the Daily chart. This line has been tested a number of times in the past and this breakout could mean an upcoming change from the current trend. It may continue in its current direction toward 37291.0940.
Related Posts
CAC 40 is approaching a resistance line of a Channel Up. It has touched this line numerous times in the last 6 days.
Emerging Channel Up pattern in its final wave was identified on the CAC 40 15 Minutes chart. After…
If DAX 40 touches 24326.0996 it may be time to take action.
DAX 40 is heading towards 24326.0996 and could reach this point within the next 3 days. It has…
After experiencing a 1.44% bullish move in the space of 4 days, nobody knows where ASX 200 is headed.
A movement of 1.44% over 4 days on ASX 200 doesn’t go unnoticed. You may start considering where…