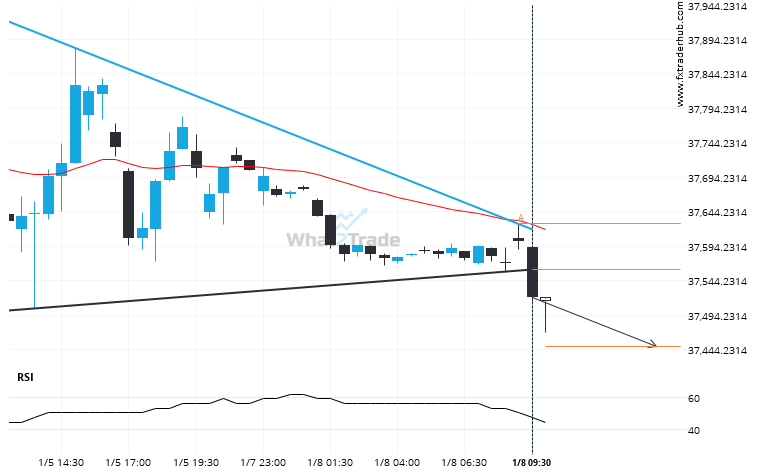
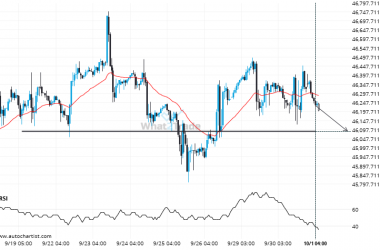
US30 moved through the support line of a Triangle at 37560.02857142857 on the 30 Minutes chart. This line has been tested a number of times in the past and this breakout could mean an upcoming change from the current trend. It may continue in its current direction toward 37448.7353.
Related Posts
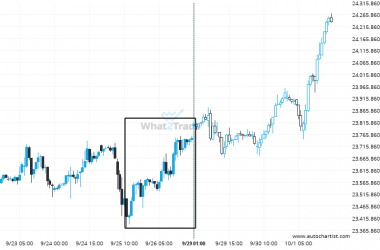
Big bullish swing on DAX 40 – this may be one of its more notable movements in the recent session.
A movement of 1.66% over 4 days on DAX 40 doesn’t go unnoticed. You may start considering where…
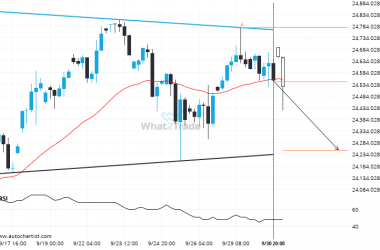
A possible move on NAS 100 as it heads towards support
NAS 100 is approaching the support line of a Triangle. It has touched this line numerous times in…
DOW 30 is approaching 46089.0000. We expect either a breakout through this line, or a rebound.
DOW 30 is heading towards a line of 46089.0000. If this movement continues, the price of DOW 30…

