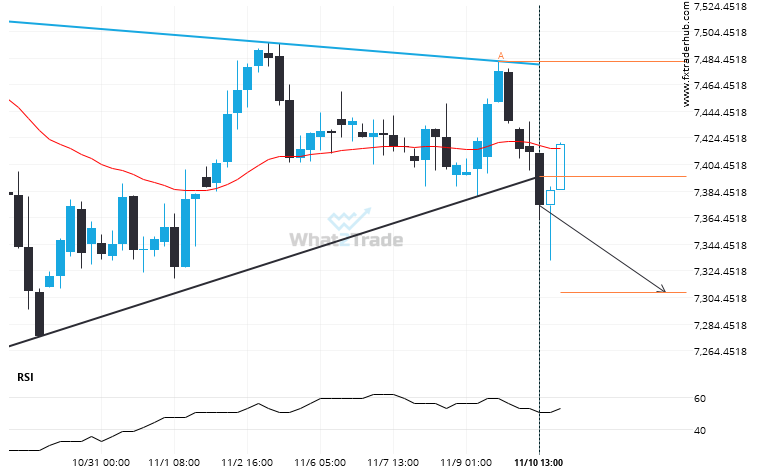
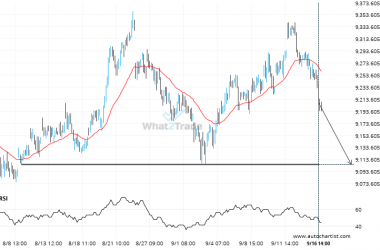
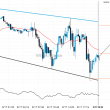
You would be well advised to confirm the breakout that has just occurred – do you believe the move through support to be significant? Do you have confirming indicators that the price momentum will continue? If so, look for a target of 7308.0509 but consider reducing the size of your position as the price gets closer to that target.
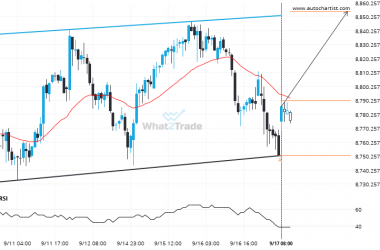
Related Posts
FTSE 100 is signaling a possible trend reversal on the intraday charts with price not breaching resistance.
An emerging Channel Up has been detected on FTSE 100 on the 4 hour chart. There is a…
After testing 44490.4492 numerous times, DOW 30 has finally broken through. Can we expect a bearish trend to follow?
DOW 30 has broken through 44490.4492 which it has tested numerous times in the past. We have seen…
US 500 has broken through resistance of a Triangle. It has touched this line at least twice in the last 6 days.
US 500 has broken through a resistance line of a Triangle chart pattern. If this breakout holds true,…