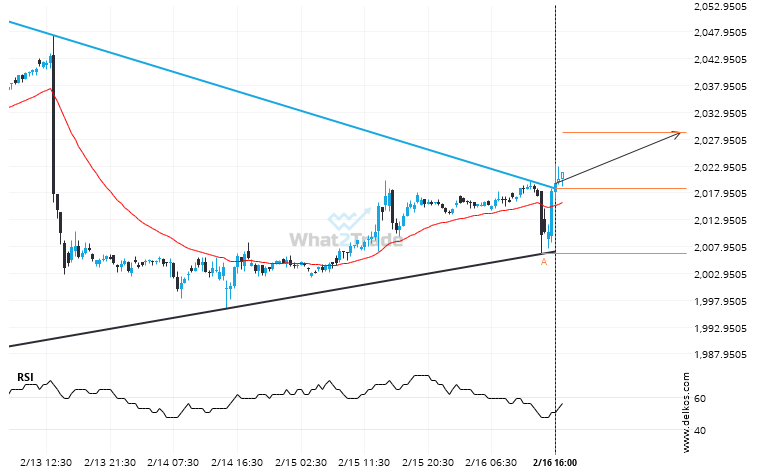
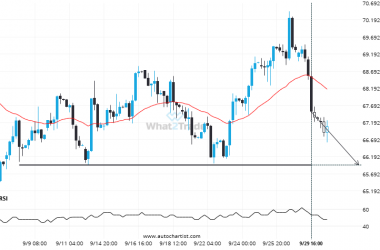
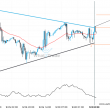
Gold April 2024 moved through the resistance line of a Triangle at 2018.6896296296293 on the 30 Minutes chart. This line has been tested a number of times in the past and this breakout could mean an upcoming change from the current trend. It may continue in its current direction toward 2029.1598.
Related Posts
Supports and resistances are primary concepts of technical analysis. Brent Crude is heading for an important price of 68.0950 – read about what this could mean for the future.
Brent Crude is en route to a very important line that will be a definite deciding factor of…
Gold Spot formed a Channel Up on the 1 hour chart. Retest of support in sight.
Gold Spot is moving towards a support line which it has tested numerous times in the past. We…
Natural Gas is signaling a possible trend reversal on the intraday charts with price not breaching support.
Natural Gas is heading towards the resistance line of a Rising Wedge. If this movement continues, the price…