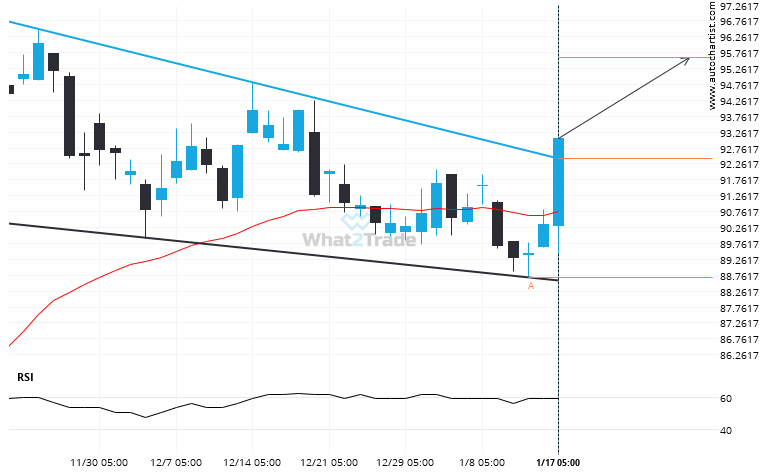
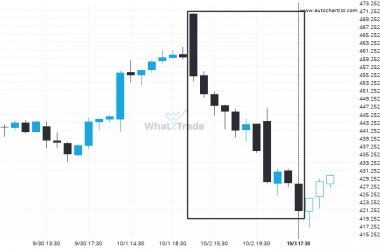
The Walt Disney Company has broken through a resistance line of a Falling Wedge chart pattern. If this breakout holds true, we may see the price of The Walt Disney Company testing 95.60 within the next 12 days. But don’t be so quick to trade, it has tested this line in the past, so you should confirm the breakout before taking any action.
Related Posts
AAPL likely to test 253.7800 in the near future. Where to next?
AAPL is approaching a support line at 253.7800. If it hits the support line, it may break through…
V formed a Rising Wedge on the 1 hour chart. Retest of resistance in sight.
V is heading towards the resistance line of a Rising Wedge and could reach this point within the…
Extreme movement experienced on TSLA. Check the chart to see what to do next.
TSLA recorded a considerable move in the last day — one of its biggest in recent sessions.

