The Alligator Index, as its name suggests, is highly effective at biting down on trading opportunities, or more appropriately, momentum opportunities. The Alligator Indicator is comprised of three SMMAs, or three Simple Moving Averages, that run on averages. The three SMMAs are aptly named the Jaw, the Teeth and the Lips.
The Jaw, the slowest SMMA, runs on a 13-day period.
The Teeth, in the middle, is an SMMA that runs on 8-day period
And the Lips, the most important, is a 5-day SMMA and it is the fastest.
The logic is simple and resembles the moving averages cross strategy. The strategy has three different signals.
The Alligator Mouth Open Bullish—that is when the Lips are above the Teeth and the Teeth is above the Jaw. When the three SMMAs align this way it is a signal for a bullish momentum and a buy.
The Alligator Mouth Open Bearish—this is the exact opposite of the bullish signal, with the Lips below the Teeth and the Teeth below the Jaw.
The Alligator is Sleeping—if the price starts to move in a more horizontal manner or if the averages diverge, it is called an Alligator Sleeping, which is another way to say there’s no trend.
When to use the Alligator Indicator
The Alligator Index’ strength is in its unique quality. It is a momentum index and yet it is most effective over the long term rather than short term as may be expected with a momentum index.
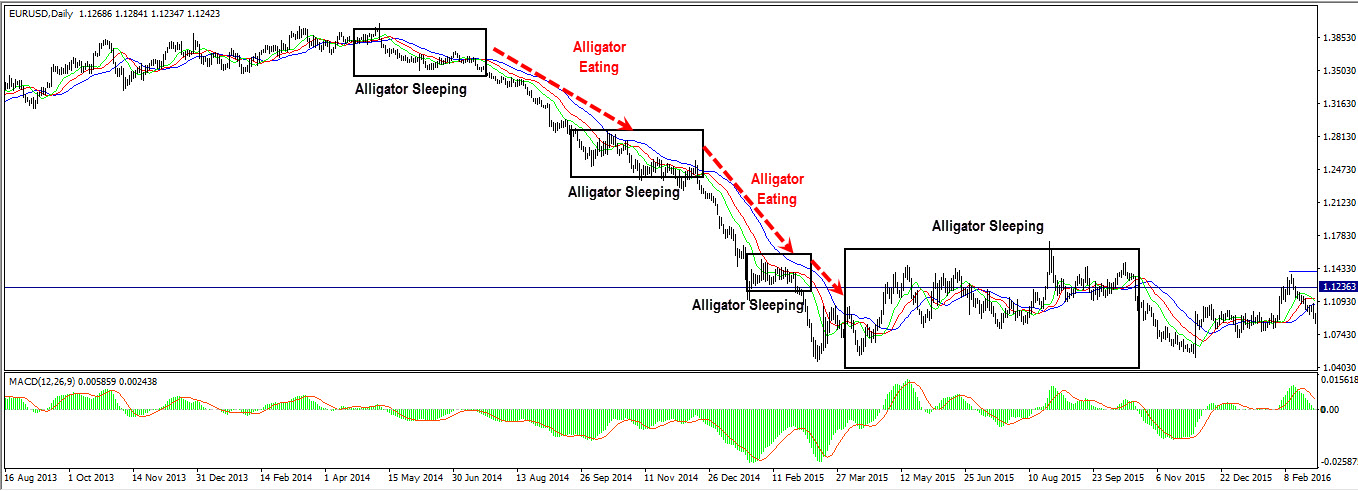
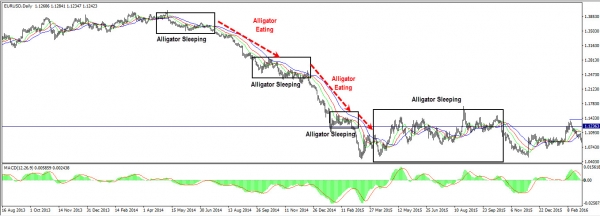
“Eating” and that is a bearish trend. Naturally, an Alligator Eating Bullish signal would be the mirror of the bearish signal with the Lips on top.
When the Alligator is Sleeping
The reason that the Alligator Indicator Sleeping mode is somewhat more complicated is because it is more difficult to recognize and also because it could either be a signal to keep holding the position or to close it, depending upon the buildup.
Using the same chart but with a different overlay we can focus on the tools and rules that help us recognize a Sleeping Alligator.
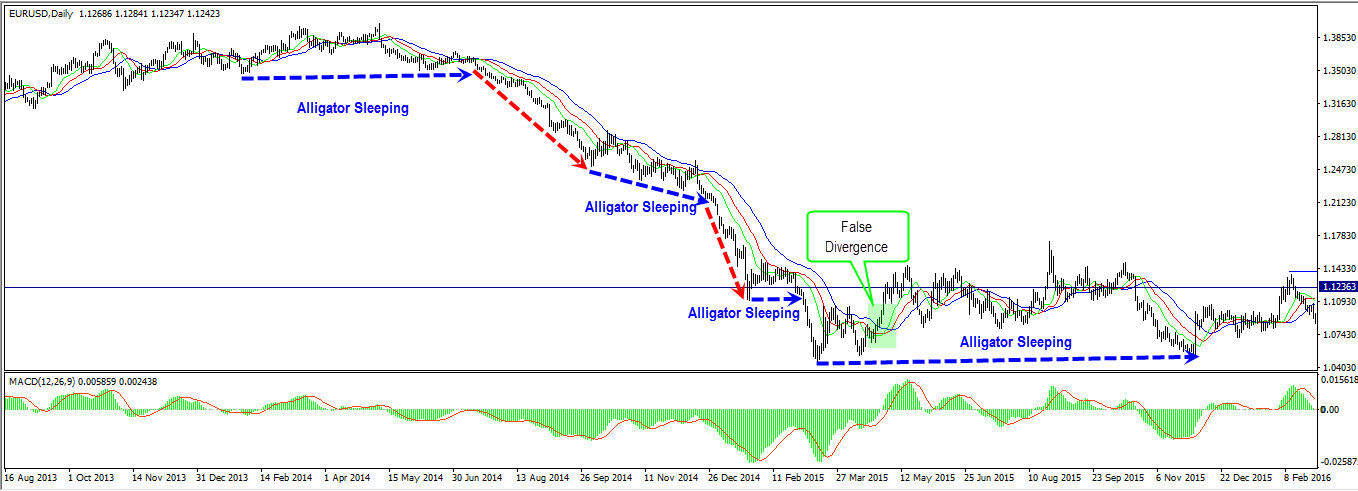
The first notable sign our Alligator Indicator has gone to “Sleep” is a wave that moves horizontally, or at least more horizontally than the preceding wave. This is clearly demonstrated by the blue arrows overlaid on the chart. When the price wave moves more horizontally and as long as the Lips are not crossing the Jaw, it is a signal to hold your position rather than close it—the trend is not over.
The second sign, which is also a warning, is if the averages start to diverge and cross one another. The Lips crossing the Jaw is not only a sign of a Sleeping Alligator but also a sign to close the position.
An important pitfall to avoid could occur after the cross; the Lips returns to cross below while the wave is still horizontal, as seen in the final wave in the chart. Because the wave is still horizontal the Alligator is still sleeping and because it was a close sign, it means we should not have reopened a position.
It is also important to look at the length of the Alligator Sleeping Phase compared to the Eating Phase that preceded it. If the Alligator Sleeping Phase is much shorter, don’t expect a trend change. Only after the Alligator is sleeping longer than the preceding Alligator Eating wave can a change in trend be the logical assumption.
Finally, another important practice that will help you avoid an Alligator pitfall is to always use an Alligator Indicator in conjunction with an MACD indicator. If the Alligator was Sleeping and suddenly turns into an Alligator Eating Bearish signal (or Bullish Signal if it is a bullish trade), and the MACD suggests weakening momentum, then the Alligator might be sending a false signal and is therefore still in a Sleeping Phase.

