
Browsing Tag
Triangle
1703 messages
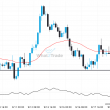
US Treasury Bond MARCH 2023 – cassure d’une ligne de tendance de support qui avait déjà été testée au moins deux fois auparavant.
US Treasury Bond MARCH 2023 a franchi la ligne support d’une configuration de graphique technique Triangle. Comme nous…

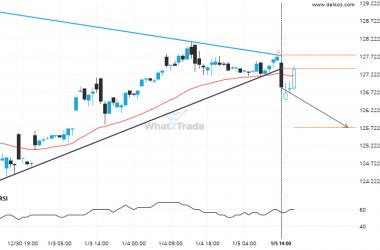
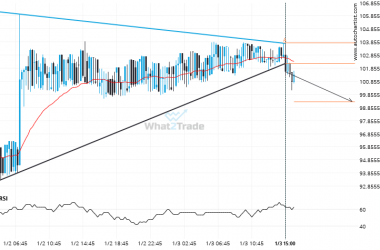
USD/CHF – breach of a trending resistance line that has been tested at least twice before.
USD/CHF has broken through the resistance line of a Triangle technical chart pattern. Because we have seen it…
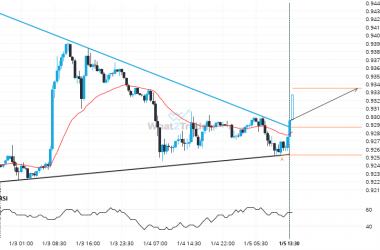
USD/CHF – cassure d’une ligne de tendance de résistance qui avait déjà été testée au moins deux fois auparavant.
USD/CHF a franchi la ligne resistance d’une configuration de graphique technique Triangle. Comme nous l’avons vu retracer à…

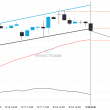
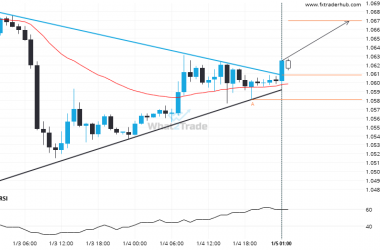
Ligne de tendance de résistance cassée par 10 year US Treasury Note MARCH 2023. Ce prix a déjà été testé au moins deux fois auparavant.
10 year US Treasury Note MARCH 2023 a franchi la ligne resistance qu’il a testé deux fois dans…
Resistance line breached by 10 year US Treasury Note MARCH 2023. This price has been tested at least twice before.
10 year US Treasury Note MARCH 2023 has broken through the resistance line which it has tested twice…

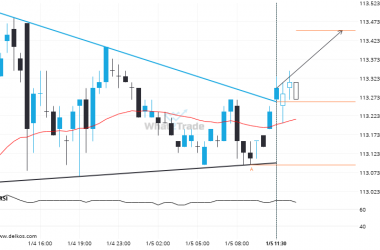
Resistance line breached by EUR/USD. This price has been tested at least twice before.
EUR/USD has broken through the resistance line which it has tested twice in the past. We have seen…
Ligne de tendance de résistance cassée par EUR/USD. Ce prix a déjà été testé au moins deux fois auparavant.
EUR/USD a franchi la ligne resistance qu’il a testé deux fois dans le passé. Nous l’avons déjà vu…

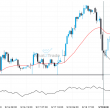
Soybean Meal MARCH 2023 – breach of a trending support line that has been tested at least twice before.
Soybean Meal MARCH 2023 has broken through the support line of a Triangle technical chart pattern. Because we…
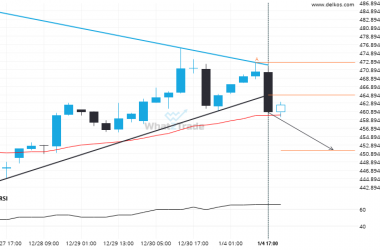
Soybean Meal MARCH 2023 – cassure d’une ligne de tendance de support qui avait déjà été testée au moins deux fois auparavant.
Soybean Meal MARCH 2023 a franchi la ligne support d’une configuration de graphique technique Triangle. Comme nous l’avons…
Breach of support could mean a start of a bearish trend on LTCCAD
LTCCAD has broken through a support line of a Triangle chart pattern. If this breakout holds true, we…